Steemit Crypto Academy | Season 3: Week 7 || How to create an account on TradingView, how to use indicators,tools, features of tradingview|| by @azamrai
This is the great lecture on the trading view website. This lecture is more beneficial for those who are attached with crypto trading. Through this site we will get more better results in our trading. This site is very helpful in trading. In this lecture professor gives few questions about trading view site. I tried my best to answer all the questions in well manner. Lets start.
i. Defining the TradingView site and how to register an account in tradingview?
Making account on TradingView is very easy. We can make account on TradingView by follow the following few steps.
Step:1
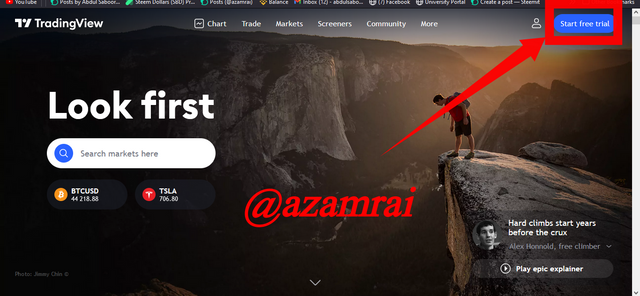
- Go to your browser and search tradingview.com
- Here is the Dashboard of TradingView.
- Click on Start Free Trial button for Registration
Step:2
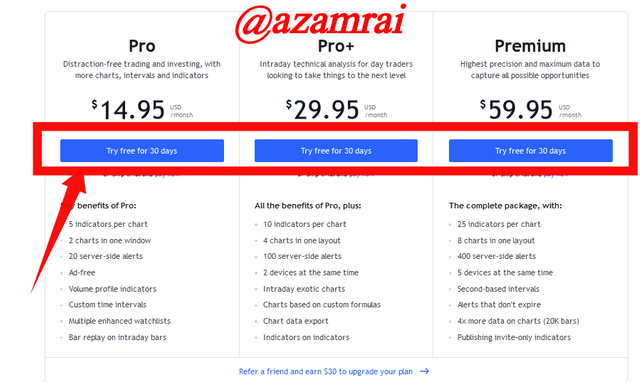
- Next is shown the all types of packages.
- You need to Click on the Try free for 30 Day Button.
Step:3
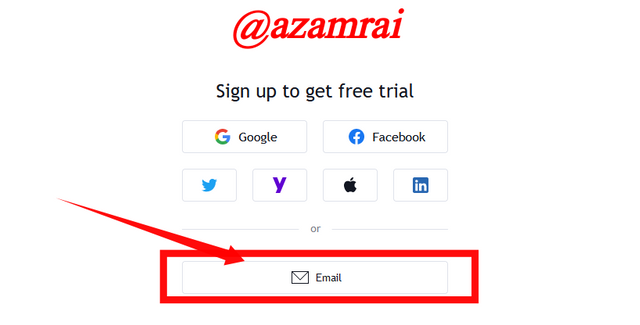
- Select the way you want to sign up.
- I Select Email for Sign Up.
Step:4
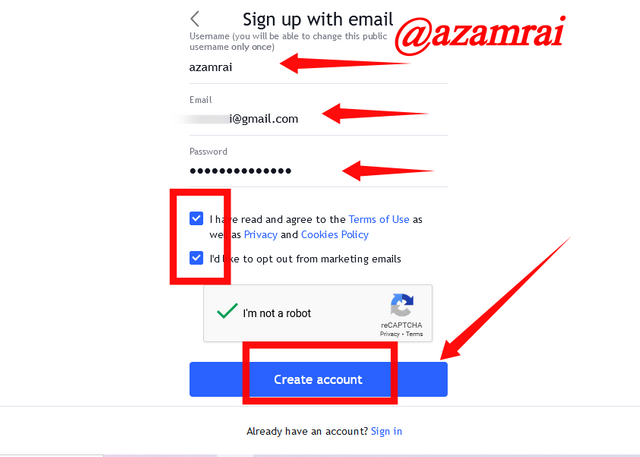
- Here is the sign-up form. You need to enter the details that required in form.
- Enter user name.
- Next enter email.
- Next enter password.
- Check the term and conditions.
- Click on the Create Account Button.
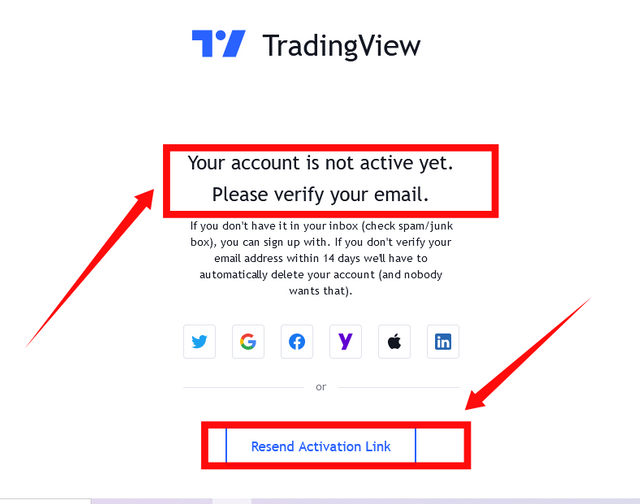
Step:5
- After Clicking on the Create account button, they send us conformation email.
- Our account is not activated. It is activated after confirm the email.
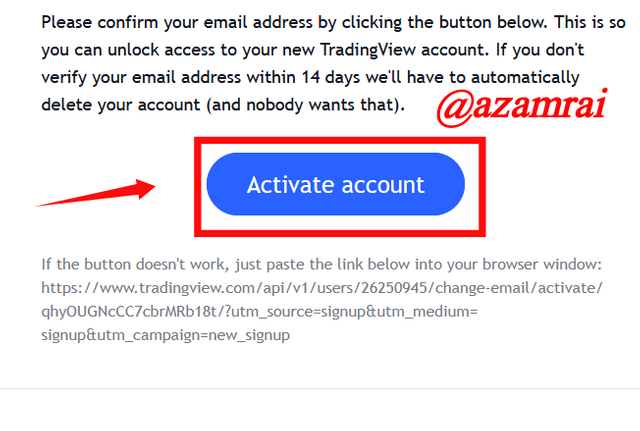
Step:6
- Here is my email account.
- We can see the Confirmation button.
- Click on Activate Account Button.
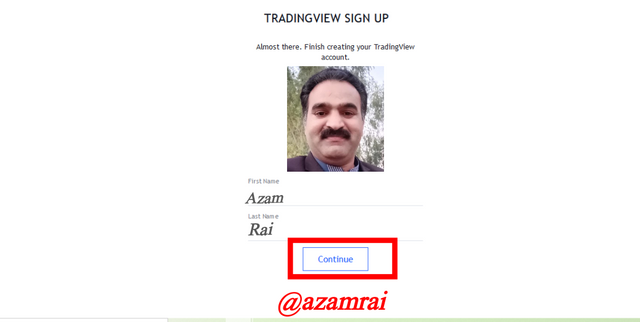
Step:7
- Here is the form of basic information.
- Select you Picture.
- Enter Your First name.
- Enter the you Second Name.
- Finally Click on the Continue Button
When we click the Continue Button, our account is automatically created.
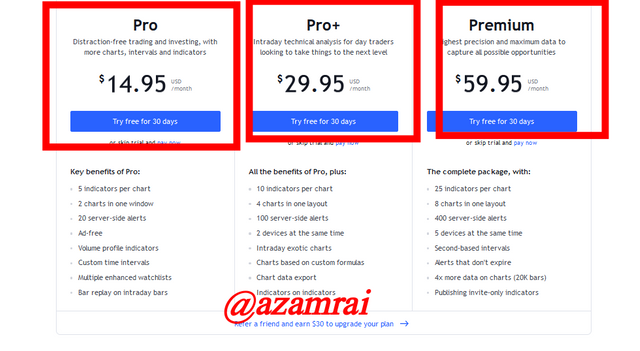
ii. What are the different registration plan?(screenshot necessary)
There are three registration plans. You see the different plans in following figure with corresponding prices in dollars.
- Pro = $14.95
- Pro+ = $29.95
- Premium = $59.95
.png)
Explain the different features of TradingView and what is your favorited feature and why?(screenshot necessary)
In this website there are many features. We will explore not all but few feature. We will understand how it works, and it what way these features are helpful in trading.
Chart
Crypto Chart is major part of this site. We can examine the chart of any asset. We can predict the future price of an asset by examine the current and previous price movement of particular asset. Technical analyses of a coin is done on the basic of chart study. If we under how to do technical analyses by using the charts, then we will able to make good profit by predicting the exact price movement of particular asset.
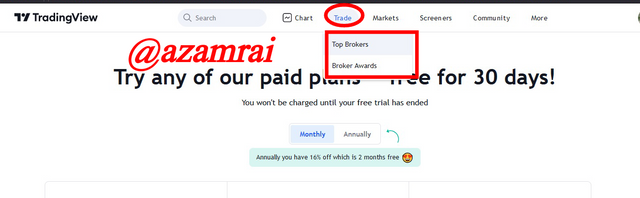
Trade
This another feature of this site. Using this feature, we can find out top Broker on this site. In this section broker are listed according the ranked they had. If open account on with brokers then they teach us how to trade and when to trade.
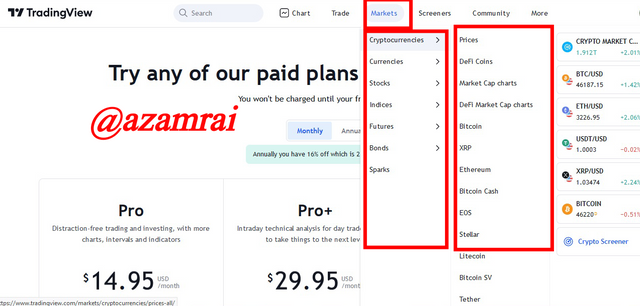
Markets
This is also a feature of this site. In this section we can see that there are many options available in it. Market tab dropdown consist of Cryptocurrency, Currency, stocks, Indices, Sparks and Bonds.
If we click on the cryptocurrency tab, it will show you the famous cryptocurrencies on our screen. Using feature, you find out the price of particular cryptocurrency. Defi coins is separate tab in this feature. You can also find out the Market cap chart. By clicking on it.
Next is Currency tab, in this tab different fiat currency pairs are listed. In this section we will find out the price of our native currency value in other currencies like USD. Currency pairs are also listed on it. We can trade with other currencies.
There are many features in this tab like stocks, indices, feature and bonds. You can explore these tabs by clicking on corresponding tab.
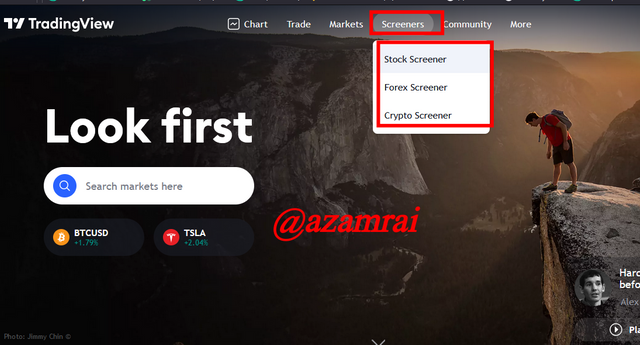
Screeners
This section is comprising of Stock Screeners, forex Screener and Crypto Screeners. According to different values assets are listed on it. You can change the sorting order of these assets. In this feature you can get best results in very short period of time.
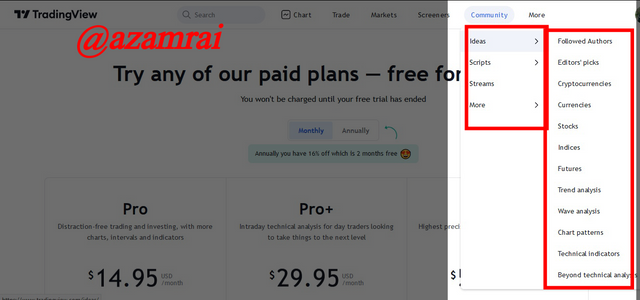
Community
This feature is divided in to different parts like ideas, Streams and Scripts. Here we can get enough information about trading. Different article of different authors are listed on this tab. You can get benefits from them. Articles that are presented on is highly verified.
Which is your best feature and why?
Best feature on this site is Chart. Because this feature help me to understand and read the movement of price. I can examine the chart of any crypto asset. Peoples who are connected with crypto trading knows that profit of crypto trading is dependent on the technical analyses of particular coin. This is why Char feature is my best feature.
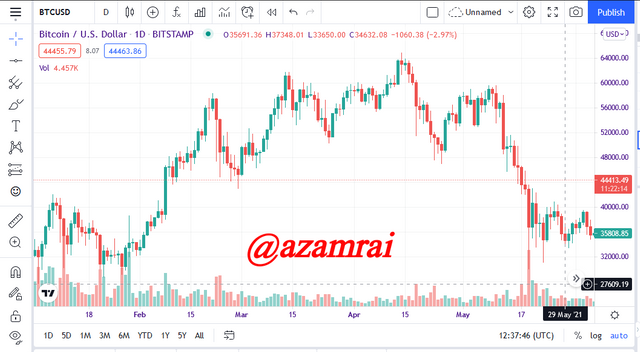
How to set up a chart in TradingView and use two tools to edit it.(screenshot necessary)
Setting up the chart in TradingView is very easy. Using the following few steps we can apply the chart.
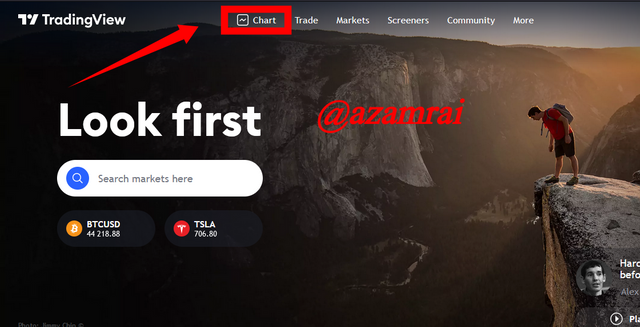
Step:1
- Click on the Chart tab that is presented on the Main Navigation bar. As we you see in the figure.
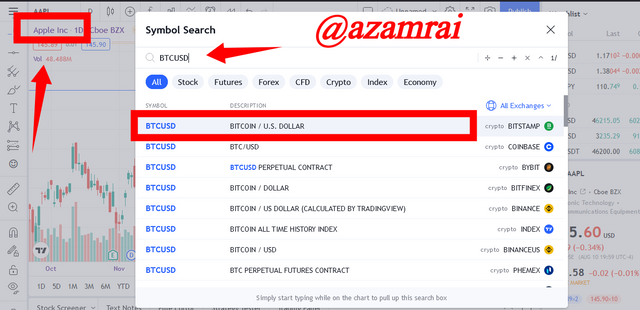
Step:2
- Click on the pair of cryptocurrencies.
- Here enter the your pair of cryptocurrencies that you want to see.
- I enter the BTC&USD Chart. As you can see in the figure.
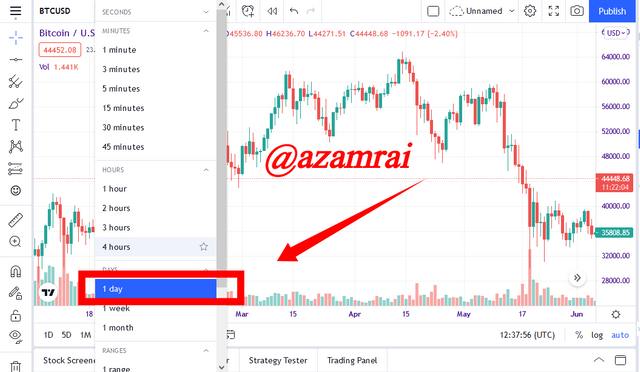
Step:3
- Next Set the time period of chart.
- I set the 1 Day.
Step:4
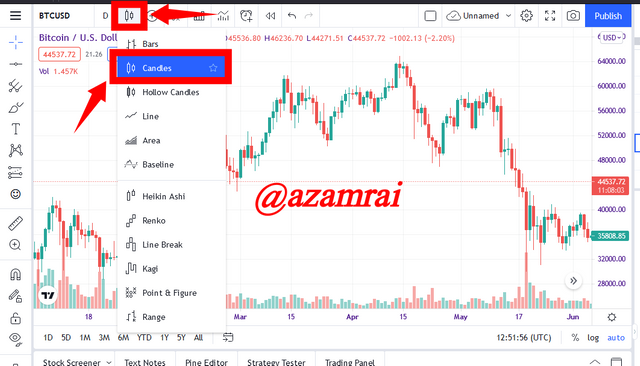
- Set the Candle Stick Style.
- I set the Candles tab. Candles are shown in figure. Candles are easy to understand.
Step:5
- Go to setting.
- Here you can customize the color and style of your chart.
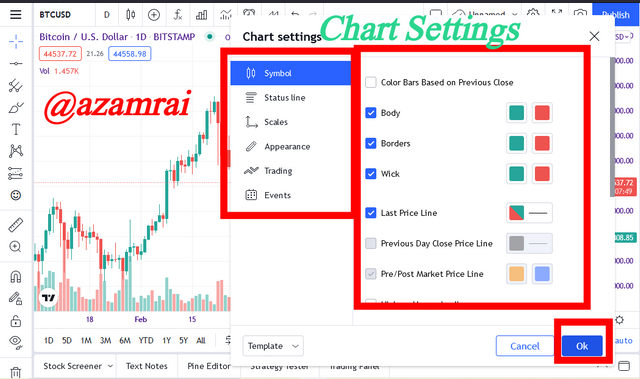
In this way we can apply chart and setting up few changes it.
Use Two tools and Edit the chart.
I use two tools one is Horizontal line and other is Text.
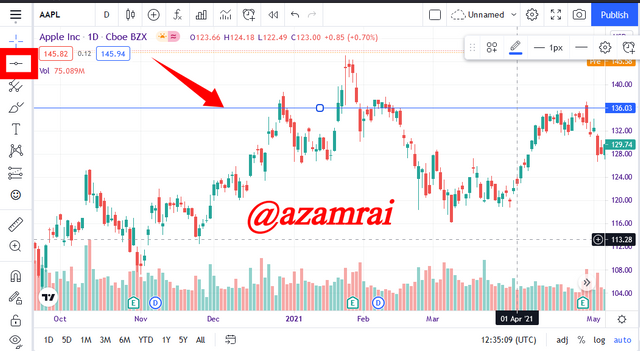
Horizontal Line
Fist I Select the Horizontal line form the tool bar. Then Click on the particular place where I wan to draw a horizontal line.
Horizontal line is applied to chart as shown in figure.
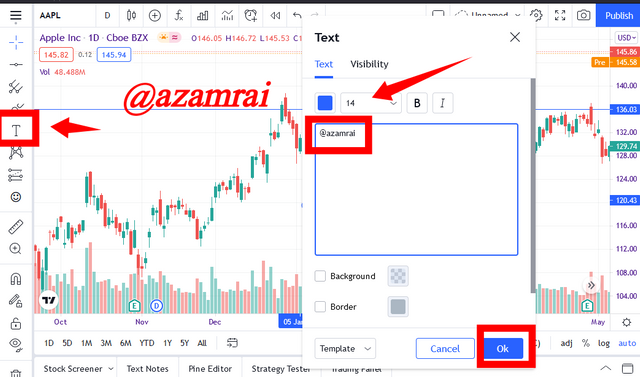
Text
Second is insert some text on the chart. I select Text option from the tool bar and click on the place on chart where I want to apply chart.
I write my user name on the chart.
Explain how to add indicator in chart, what is your your favorite indicator and why? (screenshot necessary)
Here the steps to apply indicator on the chart.
- Click the Indicator button on the top left menu.
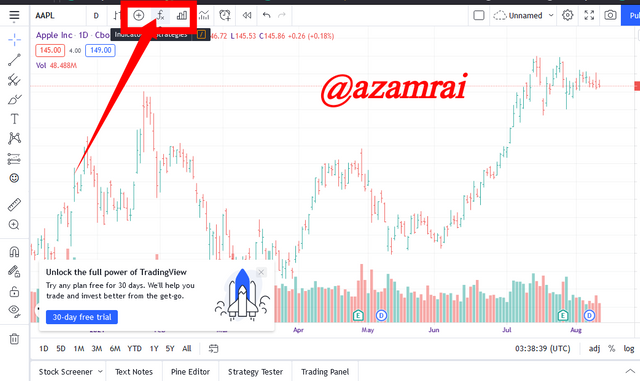
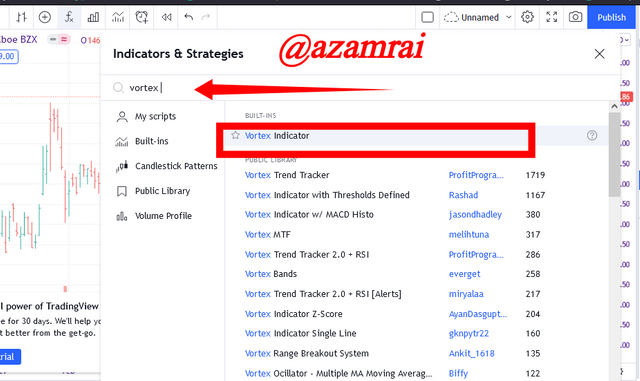
- Search for particular indicator.
- I search the vortex indicator.
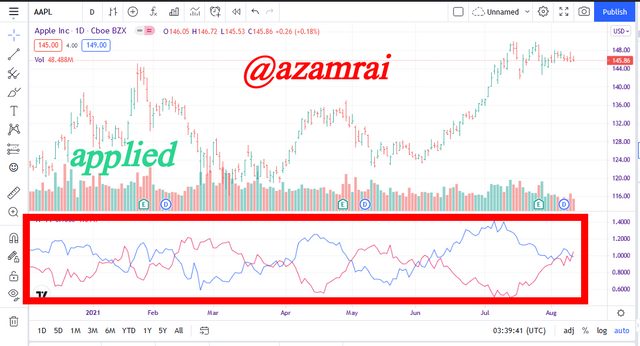
- Click on the Vortex indicator.
After clicking our indicator in automatically applied on the char. As you see in the figure.
What is your favorite chart and why?
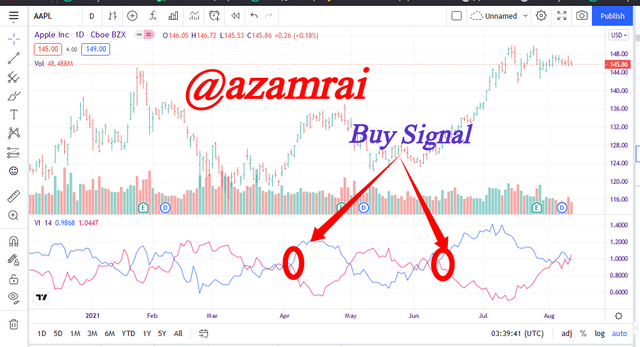
Vortex Indicator is my favorite chart. Because vortex indicator blinks the signal of buying and selling when the price of particular asset is going down or up in future. When we use this indicator with MACD indicator the results are very positive. This is way Vortex indicator is my best indicator.
Buy Signal
When blue ve+ line cross the red ve- line from bottom to top. It indicates the buy signal.
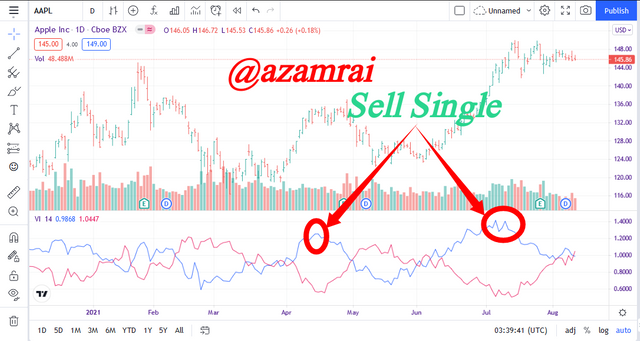
Sell Signal
When blue line indicator is ready to go down. This indicates the sell signal.
Do you think TradingView is useful in predicting the market for cryptocurrency (trend / price)?
TradingView is very helpful in predicting the market price of any cryptocurrency. In TradingView there are many features that help us to predict the price value of an asset. Charts are different cryptocurrency pairs used for the technical analyses of that pair.
It helps us a lot to predict the price. Further different types of indicators facilitate us to predicting the price and alert us when to buy and sell. All these are valuable and helpful if you have a technical knowledge about cryptocurrency. After that TradingView is very helpful in trading.
TradingView is very good platform. This site is helps the trader to predict the price of particular asset. With out reading chart of asset, we could not invest in any asset. TradingView provide facility to read the chart and do the technical analyses. I use this chart and apply different indicators on TradingView to predict future price.
I have learned many things from this post. This is a great lecture on trading view website. We learned about how to make account on trading view website. Learned how to use this site. I also familiar with different features of this site. Feature like crypto chart, blog and news, markets and many more. In this post,
I learned how insert different indicator on charts. Different tools are available on this site, we can use these tools to edit the chart and apply markdowns on it. Vortex Indicator is my favorite indicator. TradingView is useful for predicting market values of cryptocurrencies.
Written by:
@azamrai
Hi @azamrai
Thanks for participating in the Steemit Crypto Academy
Feedback
This is good content. Well done with your practical study on Tradingview.
Thank you for checking my task dear
professors @yohan2on and @yousafharoonkhan.