Starting Crypto Trading - Steemit Crypto Academy |S6W1 - Homework Post for Professor @pelon53

This is a very informative and basic lecture that we should learn before starting trading. This is about the fundamental and technical analysis of the crypto assets. I have cleared all my doubts about fundamental and technical analysis. I try to answer all the questions in my own words. I hope it will help you understand the concepts of fundamental and technical analysis.

In your own words, what is fundamental analysis?
If we talk about the traditional fiat currency, the value of a currency is not enough volatile but the values of fiat currency are up and down on small scale due to many economic and financial issues. If the country's financial or economic condition is strong then the currency values increased otherwise it decreases.
There are many factors are affecting the values of currency like interest rate, lack of resources, GDP, and unemployment in the country. If we talk about the cryptocurrency market, the values of cryptocurrencies are also affected by different financial or economic factors. So, the traders do fundamental analysis of the particular crypto asset before investing.
Fundamental analysis tells us what are the financial and economic growth of a particular asset. Fundamental analysis tells us about the financial and economic events of particular. Investors investigate the selected asset thoroughly by doing the fundamental analysis. Fundamental analysis is mostly done by long-term traders.
In this process, they understand the financial report, event, supply, and demand. If the selected asset fulfills all the requirements of investors, then the investor invests in a particular asset. In the fundamental analysis, investors investigate the particular asset.
- Partnership with well-known brands
- Listing on well-known Exchange
- Supply and Demand of particular asset
- System Updates
All the above points are considered while doing fundamental analysis. When a particular token or coin is listed on a well-known exchange then the investor or traders attract toward this coin and start investing. When any coin faces an update, the price value is also increased. Supply and demand also play an important role in price enhancement. When a particular coin start burning, it means that the supply of a particular is decreased which causes an increase in the demand. When demand increased than the price also increased.

Do you think the fundamental analysis is important for a trader?
Fundamental analysis is very important for traders before investing in any asset. Traders should know about the financial, economic condition, listing on exchanges, Total supply and Demand, Burning, and system updates.
Because all these factors have a great influence on the price. Traders should check all the details about the asset before investment. But on the other side, the things that are involved are not a hundred percent sure. But they have a great influence on the values of cryptocurrency.
Sometimes fake news and events are designed by big whales. They create artificial panic in the market. Because they bought the asset at a low price by creating panic situations by putting the fake news or events on the social platforms.

Explain what you understand by technical analysis and show the differences with fundamental analysis.
Technical analysis is completely different from fundamental analysis. In the technical analysis, we predict the future price of an asset on the basis of previous price data of an asset. In the technical analysis, there are many tools are used to perform the analysis. It is totally based on the psychology of an asset.
We predict the future movement of an asset on the basis of historical data of a particular asset. The chart, support, resistance, technical indicators, volume, volatility, and different technical tools. technical analysis is a widely used analysis by traders. Most of the traders invest after identifying the support level and sell at the resistance level.
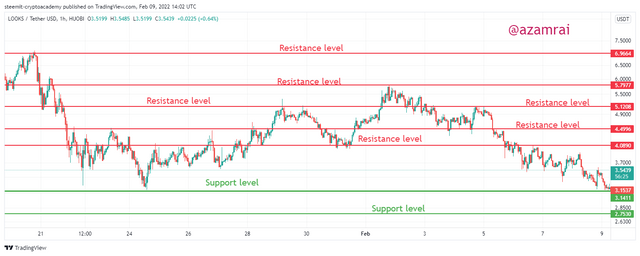
There are many other tools involved in technical analysis to avoid a huge loss. Risk management is the major part of technical analysis. In this, we decide our entry, exit, and stop-loss levels after identification of support of resistances. There are several other tools used in technical analysis that are patterns.
Traders decide the entry and exit point after the identification of different patterns on the chart. Rectangle, triangle, flag, wedge, head and shoulder, cup and handle, and double-bottom patterns are a few of them. These patterns are formed, traders confirm that the market behaves the same as it behaves a few times ago.

Difference Between Fundamental and Technical analysis
Fundamental and Technical analysis are different from each other but both are very important for doing trading. Now we discuss the differences between the fundamental and technical analysis.
| Fundamental Analysis | Technical Analysis |
|---|---|
| In this analysis, trader predict the future price by observing the economic condition, news about asset, listing on exchange, System updates and burning | In this analysis the traders predict the future price by observing the previous price data of particular asset |
| Financial report, economic condition and government policies has great influence on future data | In technical analysis the previous support, resistance, volume, pattern formation has an influence on future price. |
| Fundamental analysis is mostly done by the long-term traders | Technical analysis is mostly done by short-term traders |
| Investor makes entry and exit decision after observing the nature of event that is going to be held | Trading decisions are made after observing the previous price movement, support and resistances |
| According to my perception, the fundamental analysis has more influence in price movement | Sometime market move in opposite direction of technical analysis |
Overall, fundamental and technical analysis both are very important for making trading decisions. So, we should both analyze before making decisions. If trader A does a single analysis and trader B does both analyses then we are right to say that trader B makes better trading decisions.

In a demo account, execute a sell order in the cryptocurrency market, placing the support and resistance lines in time frames of 1 hour and 30 minutes. Screenshots are required.
Sell Order
For executing the sell order, I chose the Paper Trading demo platform. First of all, I open the BTC/USD pair and set the time frame of 1 hour. After that, I mark the support and resistance levels. I chose this pair for placing the sell order. Because in recently BTC price pumped up. I place sell orders after determining the support and resistance levels.
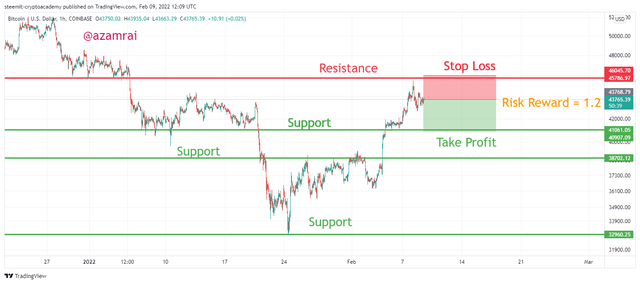
On the chart, I draw three support levels and one resistance level. I sell entry at $436768.79 and set stop loss at $45786.97 and set take profit at $41061.05. Stop loss and take profit levels are set after observing the support and resistance levels.
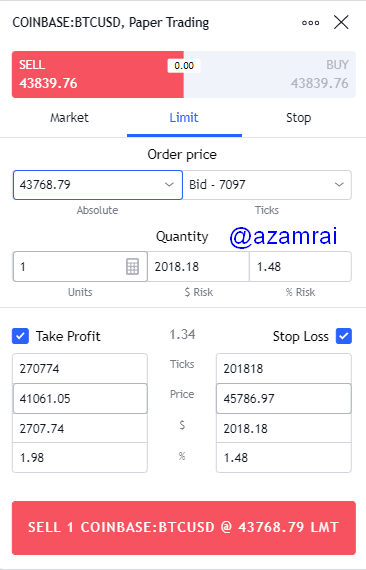
In the above figure, you can see sell order details. And the following figure, you can see that the sell order is placed on the paper trading platform.


In a demo account, execute a buy order in the cryptocurrency market, placing the support and resistance lines in time frames of 1 day and 4 hours.

Buy Order
For executing the buy order, I chose the Paper Trading demo platform. First of all, I open the LOOKS/USDT pair and set the time frame of 4 hours. After that, I mark the support and resistance levels. I chose this pair for placing the buy order. Because in recently LOOK price faces huge dump. So, it is great to buy opportunities for buying. I place buy orders after determining the support and resistance levels.
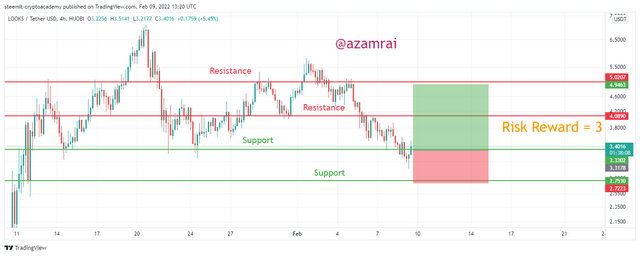
On the chart, I draw two support levels and two resistance levels. I sell entry at $3.3178 and set stop loss at 2.7223 and set take profit at $4.9463. Stop loss and take profit levels are set after observing the support and resistance levels. The risk and Reward Ratio is 3.
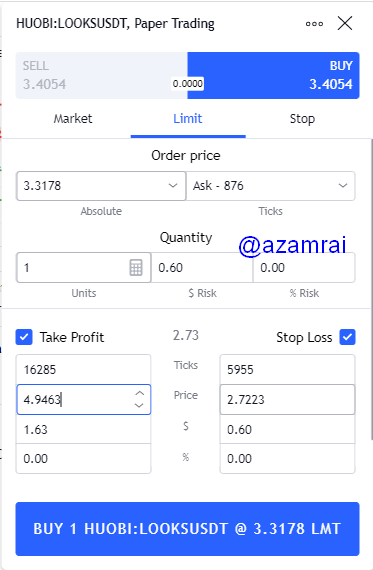
In the above figure, you can see buy order details. And the following figure, you can see that the buy order is placed on the paper trading platform.


Explain the “Hanging Man” and “Leaking Star” candlestick patterns. Show both candlestick patterns on a cryptocurrency market chart. A screenshot is required.
There are several patterns that are identified by the traders while doing the technical analysis. Hanging Man and Leaking Star are of them. Traders make decisions after the formation of these patterns. Now we will discuss both patterns and also see what how these patterns look like. We will also see what are the decisions made by traders after the identification of these patterns.

Hanging Man
Hanging Man is a candlestick with approximately the same opening and closing price. When this candlestick opened, huge selling pressure appears. The price of assets goes down. But at the same time at the low of this candle, the buying pressure is also incurred. Due to buying pressure, it brings the price up at the same level when it opens. So, in this way, the opening and closing of the candlestick are approximately the same.
We can identify the Hanging man candle by observing its shape. When the opening and closing of candlestick same with long lower wick then we can say that it is hanging man candlestick. In the above figure, you can see what how it looks like. After the formation of this pattern, the market is on a downtrend.
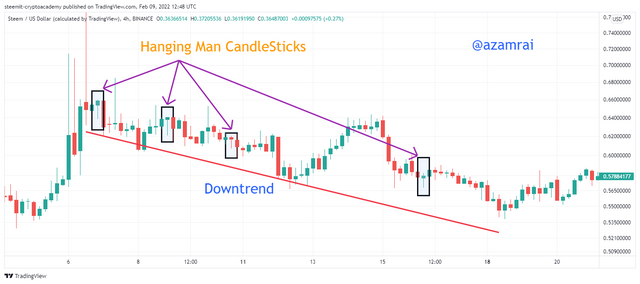
It actually represents the bearish reversal. When this candle is formed, it indicates that the current trend is not enough strong. So, it indicates that the current trend is going to end. After the formation of this pattern, the market is put itself on a downtrend. We should be very careful after the identification of this pattern.

Leaking Star
Leaking Star is the same as the hanging man candlestick but the shape of Leaking Start is in opposite direction. Leaking Star is a candlestick with approximately the same opening and closing price. When this candlestick opened, huge buying pressure entered. The price of assets goes up.
But at the same time at the high of this candle, the selling pressure has also entered the market. Due to selling pressure, it brings the price down at the same opening level. So, in this way, the opening and closing of the candlestick are approximately the same.
We can identify the Leaking Star candle by observing its shape. When the opening and closing of the candlestick same as the long upper wick then we can say that it is a Leaking Star candlestick. In the above figure, you can see what how it looks like. After the formation of this pattern, the market is on a downtrend.
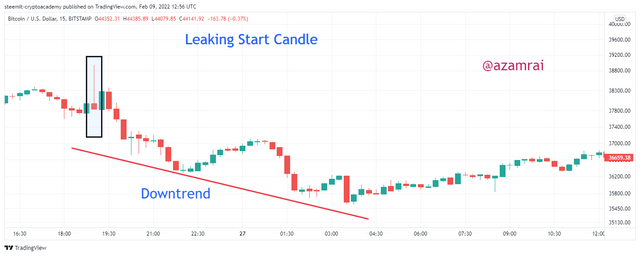
Leaking Star is also predicting the bearish reversal. When this candle is formed, it indicates that the current trend is not enough strong. So, it indicates that the current trend is going to end. After the formation of this pattern, the market is put itself on a downtrend. We should be very careful after the identification of this pattern.

Fundamental and technical analysis both are very important for making trading decisions. Fundamental analysis tells us what are the financial and economic growth of a particular asset. Fundamental analysis tells us about the financial and economic events of particular.
We predict the future movement of an asset on the basis of historical data of a particular asset. The chart, support, resistance, technical indicators, volume, volatility, and different technical tools. Hanging Man is a candlestick with approximately the same opening and closing price.
It actually represents the bearish reversal. When this candle is formed, it indicates that the current trend is not enough strong. Leaking Star is the same as the hanging man candlestick but the shape of Leaking Start is in opposite direction. Leaking Star is also predicting the bearish reversal.
