Price Bars in Technical analyses || Crypto Academy / S5W8 - Homework Post for @sachin08".


For anyone who wants to start trading then it is compulsory for him to have a knowledge of price bars and candlesticks patterns. This is a very informative lecture on price bars. I try to answer all the questions about price bars. I hope it will help you to understand this basic topic of trading.

Explain Price Bars in your own words. How to add these price bars on Chart with proper screenshots?
Price Bars are the shapes that are made by the price of the market. We get information about the market movement by using the bars. We make decisions on the basis of the information that we get from the price bars. Bars are used in charts for doing technical analyses. We apply bars over different timeframes.
Bars contain information about the price of a particular over a certain time period. If we apply the 4 hours chart then the one bar contains the price information of 4 hours. Bar comprised of four values. High, Low, Opening, and closing are the four information that one bar contains over a certain time frame.
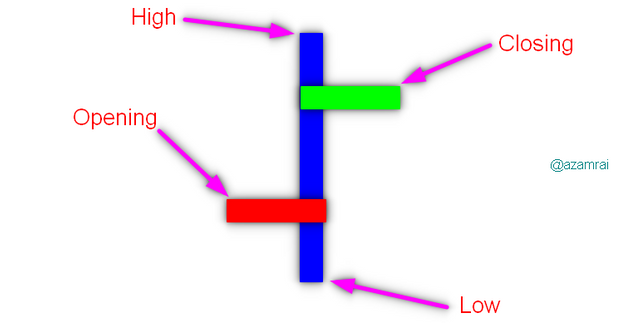
In the above figure, you can see what the how the bar looks like. The Left and dash of the vertical line indicate the opening of the candle and the right dash indicates the closing of the candle. The top of the vertical line indicates the highest price that asset reaches during making this particular bar. And the bottom line indicates the lowest values that reach this asset.
Traders do trading by observing the formation of bars. They do a bar in the chart to identify the current trend in the market. According to the current trend, they place orders in the market. Trading through the bar’s formation is not so difficult. In this, there is no formula and calculation include.

How to add Bar to the chart?
We can easily apply the bar on the chart by just doing the steps. First of all, we need to open the chart of any asset on any charting platform. Next, we need to do the following procedure. I chose the TradingView.com platform to apply the bars on the chart.
- Open any asset pair on the chart.
- Next, click on the Candles icon on the top menu.
- After that, click on the Bars from the dropdown menu of candles.

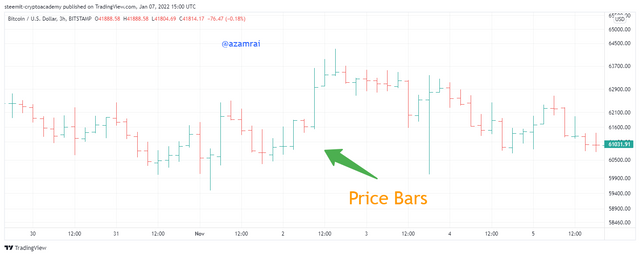
In this way, we can easily add the bar to the chart. In the following figure, you can see that the price Bars is applied on the chart.

How to identify trends using Price Bars. Explain for both trend. (Screenshots required)
We can easily identify the trend in the market using the price bars. To identify the trend in the market first, we need to understand the formation of bars and understand that how the bar represents the particular data. In the above question, we understand the formation of the bar. Now we are understanding that how we can easily identify the trend in the market.
Identify the Uptrend:
Identification of uptrend is easy using the price bars. When the closing of the current bar is higher than the closing of the previous bar. In this way, the price makes higher highs and higher lows. When price shows this behavior and makes this type of bar in which the current bar closing is higher than the closing of the previous bar then we can say the market is on an uptrend.
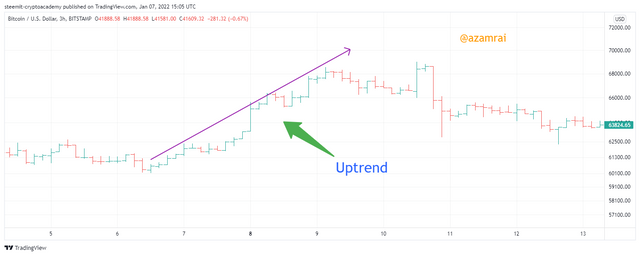
In the above figure, you can see that the closing of bars is higher than the closing of previous bars. In this way, the price makes higher highs and higher lows. You can see that after the formation of this pattern, the market is on-trend. This is not necessary for all the bars to make higher highs. Few bars are failed to make higher high. But the bar after failed one creates a higher high. So, we need to be very careful when identifying the trend using bars.

Identify the Downtrend:
Identification of downtrend is also easy using the price bars. When the closing of the current bar is lower than the closing of the previous bar. In this way, the price makes lower lows and lower highs. When price shows this behavior and makes these types of bars in which the current bar closing is lower than the closing of the previous bar then we can say the market is on a downtrend.
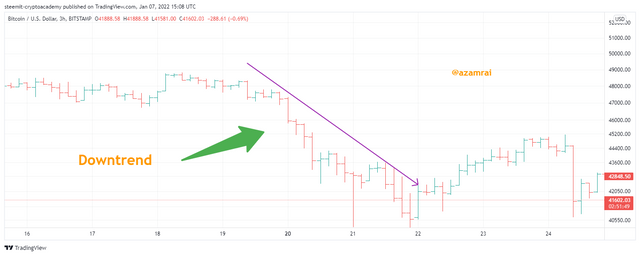
In the above figure, you can see that the closing of bars is lower than the closing of previous bars. In this way, the price makes lower lows and lower highs. You can see that after the formation of this pattern, the market is on a downtrend. This is not necessary for all the bars to make lower lows. Few bars are failed to make a lower low. But the bar after failed one creates a lower low. So, we need to be very careful when identifying the trend using bars.

Explain the Bar Combinations for Spending the Day inside for both conditions. (Screenshots required)
There are several bar combinations that help us to identify the possible next move of the price. We understand to spot the next move through the bar combinations then it is very helpful for us. In this, we will discuss one the bar combination that is Spending the Day Inside. I will explain this concept for both bullish and bearish scenarios.
Spending the Day Inside in Uptrend
It is the behavior of two candles that represents the Indecision in the market. In this bar behavior, the high of the bar is lower than the high of the previous bar. Next, the low of the bar is higher than the low of the previous bar. When this pattern is on the bullish run then it indicates that all the buyers and sellers are not interested in selling and buying.
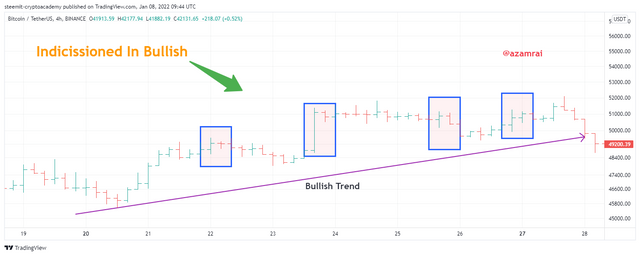
In the above figure, you can see that the market is on an uptrend. And the two bars that I mentioned are satisfied the condition of the Spending the Day Inside. In this, the high of the bar is lower than the previous bar high and the low is higher than the previous bar low. It indicates the indecision in the market.

Spending the Day Inside in Downtrend
It is also the behavior of two candles that represents the Indecision in the bearish market. In this bar behavior, the high of the bar is lower than the high of the previous bar. Next, the low of the bar is higher than the low of the previous bar. When this pattern is on the bearish run then it indicates that all the buyers and sellers are not interested in selling and buying.
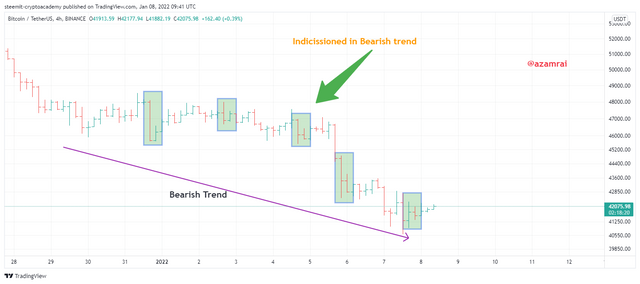
In the above figure, you can see that the market is on a Downtrend. I mentioned several two bars that satisfy the condition of the Spending the Day Inside. In this, the Low of the bar is higher than the previous bar low and the high is lower than the previous bar high. It indicates indecision in the market.

Explain the Bar Combinations for Getting outside for the Day for both conditions. (Screenshots required)
This bar combination pattern is very important because when this bar combination pattern is made then it is expected the market reversal after a while. This pattern is rarely made by the price. We will discuss this bar combination in both bearish and bullish scenarios.
Getting outside for Day in Uptrend
Before making this bar combination the market is on a downtrend. After making this bar combination, most of the time the reversal of the market is start. When the opening of the bar is equal to the high of the bar and closing of the bar is equal to the low of the bar and made this pattern by price somewhere in a downtrend then it indicates that the reversal is about to start.
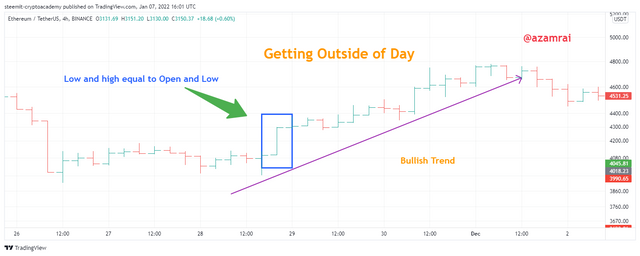
You can see in the above figure, that the market is on a downtrend before making this bar combination. But when the bar is made and the opening and closing are equal to the high low of the same bar then the market price takes a reversal. You can see that after making this bar combination, the market on up Uptrend.

Getting outside for Day in Downtrend
When the opening of the bar is equal to the high of the bar and closing of the bar is equal to the low of the bar and made this pattern by price on the peak of uptrend price then it indicates that the reversal is about to start. Before making this bar combination the market is on an uptrend. After making this bar combination, most of the time the reversal of the market is start.

You can see in the above figure, that the market is on an uptrend before making this bar combination. But when the bar is made and the opening and closing are equal to the high low of the same bar then the market price takes a reversal. You can see that after making this bar combination, the market is on up downtrend.

Explain the Bar Combinations for Finding the close at the open for both conditions in each trend. (Screenshots required)
This bar combination is also a symbol of a trend reversal in the market. It has great importance near the traders. After the formation of this combination, the market takes a reversal. Now we will discuss this bar combination formation in both bearish and bullish scenarios. We will also see the behavior of the market after the formation of this bar combination.
Bar Combination on Bottom Condition
When the bar’s closing is ended near or at the same level as the opening of bars in a bearish market and this behavior is repeated by several bars then it indicates the Clos at the Open combination patterns. When this pattern is made in a bearish market then it indicates the reversal in the market.

You can see in the above figure, that the closing of the bars at near the or name level of the opening of bars. This combination shows the range market also. After this ranging market, you can see that the market is on Uptrend. In this way, traders use this combination formation for determining the buying opportunity.

Bar Combination on Upper Condition
When the bar’s closing is ended near or at the same level as the opening of bars in the bullish market and this behavior is repeated by several bars then it indicates the Close at the Open combination patterns. When this pattern is made in a bullish market then it indicates the reversal in the market.
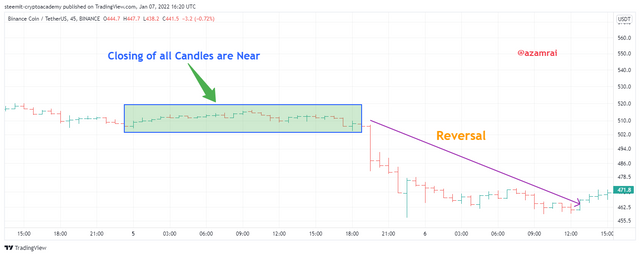
You can see in the above figure, that the closing of the bars at near the or name level of the opening of bars. This combination shows the range market in the bullish market. After this ranging market, you can see that the market is on a downtrend. In this way, traders use this combination formation for determining the selling opportunity.

Price Bars have great importance in trading. Because all the trading is based on the data that the bar contains. It is helpful for those traders who trade just using the price bars and also for those who trade using the indicator. Because indicators calculate the current data based on the previous bar’s data.
Bars are comprised of four types of data. High, Low, Open and Close is the data that one bar contains. There are several Bar combinations patterns that we can use to do trading. We can use the bar formation style for determining the trend of the market. The bar is not always trusted. Because sometimes market behaves unexpectedly. So, we should be very careful while doing trading with Price bars.
