Leverage With Derivatives Trading Using 5 Min Chart -Steemit Crypto Academy | S6W1 | Homework Post for @reddileep

This is a very informative and interesting lecture on leverage trading with derivates. Although leverage trading is very risky, we perform leverage trading with proper technical analyses, then we can earn reasonable profit from leverage trading. I have learned the techniques of performing leverage trading. I try to answer all the questions in my own words. I hope it will help you.

Introduce Leverage Trading in your own words.
Leveraged trading is trading in which we trade with assets that do not belong to us. We actually borrow assets on the behalf of our initial investment. In simple words, a particular exchange provides us tokens for trading on our initial investment. The amount of tokens we borrowed from the exchange is dependent on us. We can take leverage as much we want on our investment. More the percentage of leverage means more risk.
Leveraged trading enables us to perform big trading with a small investment. It creates opportunities for those traders who want to trade with huge capital. But they have not enough invested. In that case, traders get leverage from the exchange and start trading. Traders can take leverage from 2x to 10x and so on. It is based on your initial investment. Increased leverage will make your trade riskier. We understand this with an example.
If a trader has $100 in his wallet and he wants to trade with $1000 but he has hundred dollars. Leverage trading makes it possible to trade with $1000 even trader has $100 In your wallet. Traders go for future trading and take leverage 10x on the initial investment of $100. In this way, the exchange provides $1000 to the trader for doing trading.
This trading is very risky trading. Because if a trader invests $1000 in any asset and the market does not move in the expected direction then the trader can lose all his money when the loss is equal to the initial investment which is $100. In leverage trading, we can take advantage of both bullish and bearish scenarios.
Leverage trading is not for novice traders. It is for experienced traders that have full knowledge about the market. They perform leverage trading after depth analysis. Another thing is that leverage trading is not suitable for long-term trading. It is done on a short scale-like from 5 minutes to 30 minutes.
So, we should be very careful before doing leverage trading. Invest money in leverage trading that you are willing to lose. In the next topic, we will learn how to do leverage trading with proper safety measures and technical analysis.

What are the benefits of Leverage Trading?
Leveraged trading is good for those traders who want to do trading with huge investments but they have limited resources. We will discuss a few advantages of Leverage Trading. If we have technical knowledge about trading then leverage trading opens the door of earning.
Leverage trading enables us to do big trades even we have little investment. If we have only $10 then we can take leverage of 100x and that is $1000 then we can perform huge trade even we have only $10.
Sometimes trader knows that the market can jump but he has not had enough capital to take advantage of a bull market. Leverage trading allows the trader to take benefit by place huge trade even he has low capital.
In leverage trading, we can take leverage and invest our leverage capital into many assets in different positions. Simply they can trade in multiple positions with leverage capital.
If the market is moving in the same direction as we expected then we can invest more capital at any point. In this way, we can increase our earnings. Adding more investment protects our capital from the liquidation limit.
In Leverage trading, we can make a profit in both bullish or bearish markets by placing the buy or sell orders.
We can close our positions at any time. It means that if we do not allow the trade to execute a stop loss or take profit then we can close our position at any time.
Leverage trading is more beneficial for those traders who are experienced in swing or scalp trading.
In leverage trading mostly, we use a short time frame that is why we do not wait for a long time for our loss of profit.

Question no 3
What are the disadvantages of Leverage Trading?
After discussing the advantages of leverage trading, we are keen to start leverage trading as quickly as we can. But there are a few disadvantages of Leverage trading that we should keep in mind while doing leverage trading.
- First of all the leverage trading is not for those traders who are inexperienced.
- It is very risky. We can lose even our whole initial investment if the market moves in the opposite direction of our expectations.
- If the loss is equal to our own investment, then our positions are automatically closed.
- More trading fees are charged in leverage trading. Fess percentage increased as our holding time increased.
- In leverage trading you should invest money that you are willing to lose.

What are the Basic Indicators that we can use for Leverage Trading? (Need brief details for any essential Indicators and their purposes)
As we discussed in the above section that leverage trading is very risky. In the trading field, we also hear that “Trend is you, Friend”. So, we should first, identify the trend before making an investment. We need different technical tools like indicators that we use to identify the trend. We also need other indicators that give us trading signals. For the purpose of trend identification, we have a trend-based indicator.
There are many trend-based indicators, but we will explain a few of them that are mostly used in leverage trading. Parabolic SAR and Exponential Moving Average (EMA). We also use the Relative Strength Index (RSI) which is a volatility-based indicator. These are the indicators that we will use in leverage trading. Now we will learn about these indicators that they work and what the features are.
Parabolic SAR
Parabolic SAR is a trend-based indicator that is designed by J. Welles Wilder. It is used to identify the current market trend. Market pumps and reversals are spotted by the use of parabolic SAR. It is also to determine the buy and sell positions.
If we talk about the appearance of this indicator, it is comprised of Dots that are used to identify the current trend in the market. Dots appear on the chart when a particular trend is start. Placement of Dots are investigated current trends. When the Dots appear at the upper side of candlesticks, it indicates the downtrend in the market and when dots appear at the bottom side of candlesticks, then it indicates the uptrend in the market.
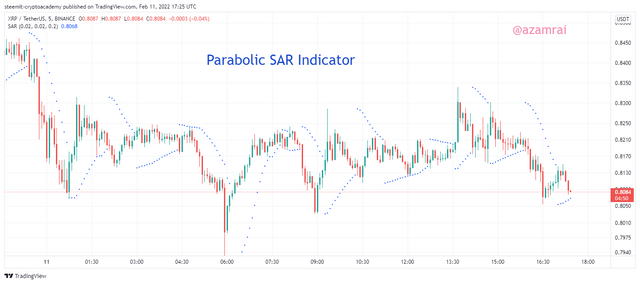
In the above figure, you can see what how the Parabolic SAR indicator looks like. You can see the formation of dots at the upper and the bottom side of candlesticks. Traders get a buy signal when the dot appears at the bottom of the candlestick and get a sell signal when the dot appears at the upper side of candlesticks.

Exponential Moving Average (EMA)
The exponential Moving Average is also a trend-based indicator. It is also used in leverage trading to determine the current trend in the market. It is basically designed to overcome the lag that we face while using the Simple Moving Average. An exponential Moving Average produce more potential result than the simple moving average indicator.
Like the Parabolic SAR, we also determine the current trend by observing the EMA placement. When the EMA is placed at the upper side of candlesticks, it indicates the bearish trend, and when the EMA is placed at the bottom side of candlesticks, it indicates the bullish trend. We are looking for placing the sell orders while EMA at placed above the candlesticks and looking for buy orders when the EMA is placed at the bottom side of candlesticks.
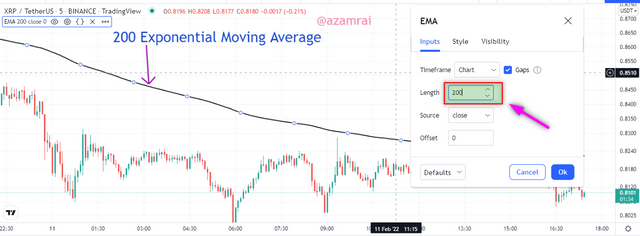
There are several timeframes that are used according to the trading strategy. In the leverage trading strategy, we set the timeframe of 200 periods that produce more filtered results. Leveraged trading is risky why we use a higher period time frame for getting a smooth result. In the figure, you can see the EMA over a 200-period length.

Relative Strength Index (RSI)
Relative Strength Index is a volatility-based indicator that is used in trading for getting the signals, trend, and trend reversals. It is comprised of one oscillating line that oscillates between 0-100 considering 50 as a pivot point. The main purpose of RSI is to determine the overbought and oversold position of a particular asset.
When they get oversold and overbought of an asset by observing the position of the oscillating line. When the line reaches the above 70, it indicates the overbought of asset and when the line reaches the below 30, it indicates the oversold of the asset. After the overbought and oversold zone, there is a higher chance of trend reversal.
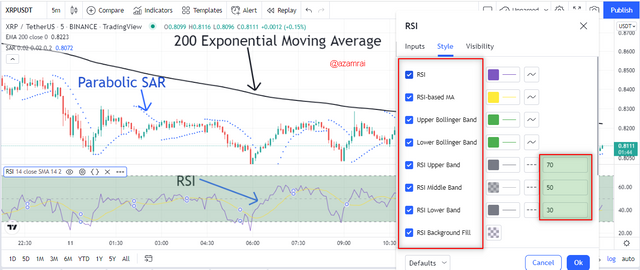
In leverage trading, we perform short-term trading in presence of a trend. So, normally we do not need any oversold or overbought signal. We consider 50 pivot points while leverage trading. When the line below the 50 and trend is bullish then we look for buy entry and when the line above the 50 and trend is bearish then we look for sell entry.
RSI indicator is recently updated. There are two more indicators merged with RSI that are Upper Bollinger Band, RSI-based MA, and lower Bollinger Band. We can use this modified RSI after configuration accordingly.

How to perform Leverage Trading using special trading strategies (Trading Practice using relevant indicators and strategies, Screenshots required)
To perform leverage trading, we need some special trading strategies that we should apply before starting leverage trading. In these strategies, first, we need to change the candlestick chart to Heikin Ashi Chart. We use this chart for leverage trading because it is smoother than candlesticks. Chart.
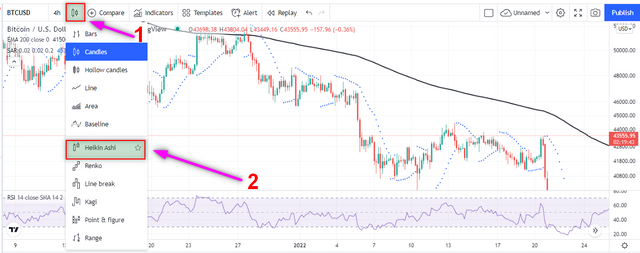
Next, we need to perform leverage trading in a short time frame from a minimum of 5 minutes to a maximum of 30 minutes. We need to do leverage trading in a short time frame because the market is enough volatile. In higher the time frame, the higher chance to lose all our assets.
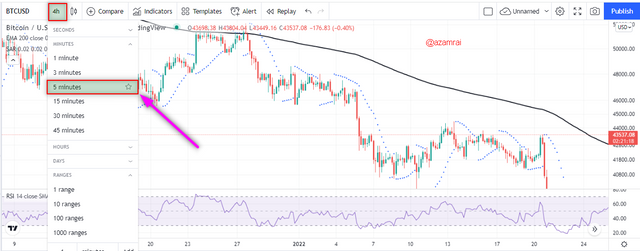
Next, we need to apply more than 2 indicators to perform leverage trading. In the above section, we have discussed trend-based indicators and volatility-based indicators.
Strategy for Buy Position
Before taking the buy position, we need to determine the current trend in the market. For this purpose, need to apply EMA on the chart with a 200-period length. If the line of EMA is below the price action, it indicates a bullish trend. After that, we need to apply check and confirm the trend with the Parabolic SAR indicator by observing the Dot placements.
If the Parabolic Dot appears under the price action, then it confirms the bullish trend. After the confirmation of the trend, we need to check the Volatility by applying the RSI. If at the same time the RSI lies under the 50 then it indicates the best buy opportunity. When all these conditions are satisfied then we look for a buy position.
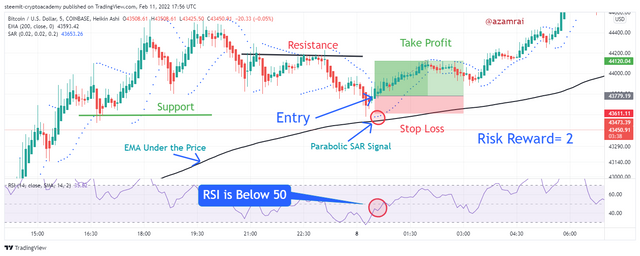
In the above figure, I mentioned the buy position after satisfaction of all the conditions. You can see that the EMA show a Bullish trend. The Parabolic SAR confirms the trend by showing the dots under price action and RSI lies under 50. After that, I place a buy order setup with risk management as you can see in the figure.
Strategy for Sell Position
Before taking the sell position, we need to determine the current trend in the market. For this purpose, need to apply EMA on the chart with a 200-period length. If the line of EMA is above the price action, it indicates a bearish trend. After that, we need to check and confirm the trend with the Parabolic SAR indicator by observing the Dot placements.
If the Parabolic Dot appears upper side of the price action, then it confirms the bearish trend. After the confirmation of the trend, we need to check the Volatility by applying the RSI. If at the same time the RSI lies above the 50 then it indicates the best sell opportunity. When all these conditions are satisfied then we look for a sell position.
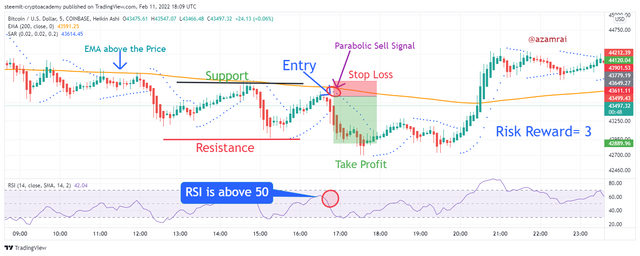
In the above figure, I mentioned the sell position after satisfaction of all the conditions. You can see that the EMA shows a bearish trend. The Parabolic SAR confirms the trend by showing the dots above price action and RSI lies above 50. After that, I place a sell order setup with risk management as you can see in the figure.

Do a better Technical Analysis considering the above-explained trading strategy and make a real buy long or sell short position at a suitable entry point in any desired exchange platform.
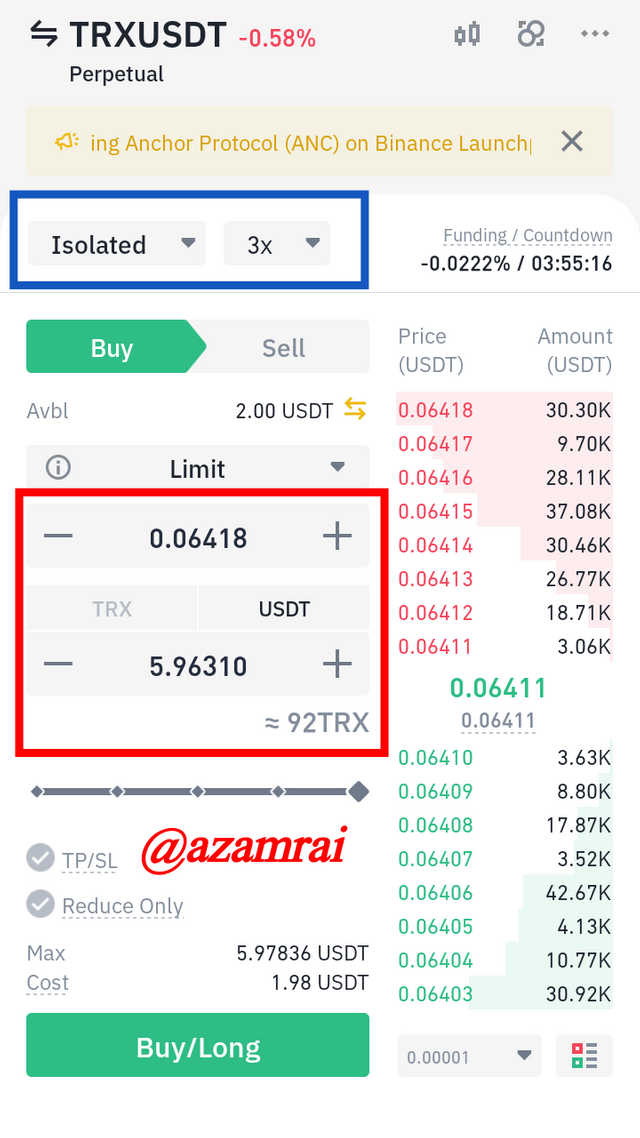
In this, I try to purchase assets on the Binance exchange. Here first we need to transfer assets to our featuring trading wallet. I transfer only 2 dollars to my future trading wallet. I want to perform Buy long trading. I choose TRX/USDT pair to buy a long position.
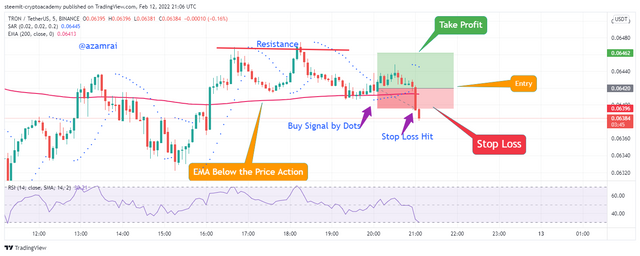
I use a proper trading strategy as we discussed in the above section. I apply the 200 EMA, RSI, Parabolic SAR, Heikin Ashi, and 5-minute time frame on the chart. I am looking for a buy long opportunity that is possible when the EMA lies under the Price action and Parabolic SAR shows the Buy signal buy placing the Dot at the bottom of price action.
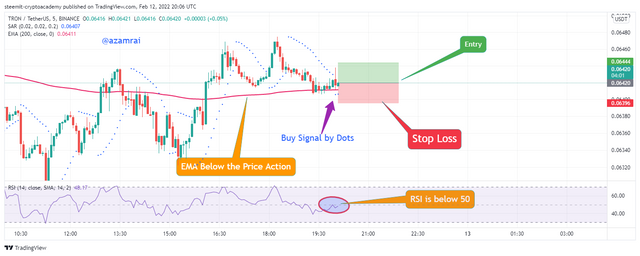
In the above figure, you can see that the EMA lies under the price action that indicates the bullish trend and Parabolic SAR Produce Buy Signal by showing Dot. At the same time, We notice the RSI Condition that is below 50. In this way, all formalities are fulfilled for buying.
I make a trade with proper risk management. In this, I apply to stop loss and take profit limit. I also set the risk-reward ratio that is 1.5. It is set after observing the resistance level.
So, place a buy order at $0.06416. I have $2 my own investment and get 3x leverage. After that my total investment in TRX is $5.96. In the following figure, you can see my trade details.
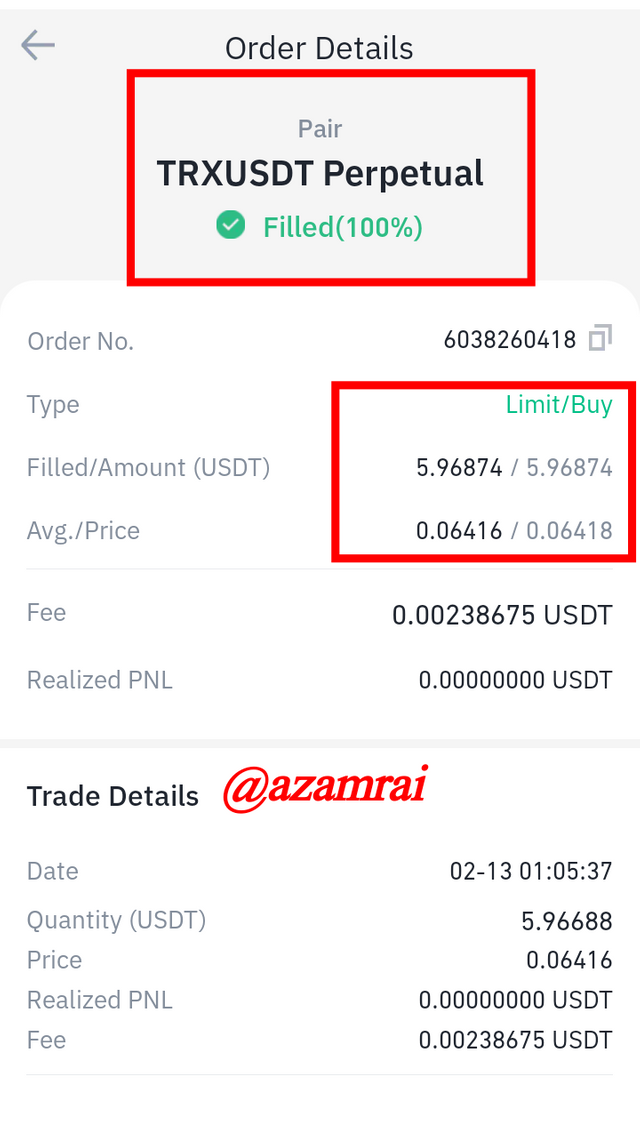
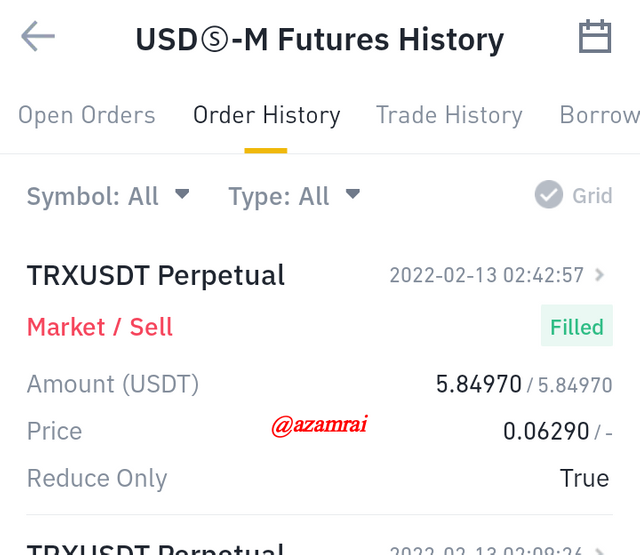
Unfortunately, my trade did not go in the way that I expected. So, my stop loss is hit. You can see in the following figure, the parabolic SAR is also showing the sell signal. That is why I close my position and take an exit from the market.
Here are my sell order details.

Leveraged trading is trading in which we trade with assets that do not belong to us. We actually borrow assets on the behalf of our initial investment. In simple words, a particular exchange provides us tokens for trading on our initial investment.
The number of tokens we borrowed from the exchange is dependent on us. We can take leverage as much we want on our investment. More the percentage of leverage means more risk. . If the line of EMA is above the price action, it indicates a bearish trend.
After that, we need to check and confirm the trend with the Parabolic SAR indicator by observing the Dot placements. If at the same time the RSI lies above the 50 then it indicates the best sell opportunity. When all these conditions are satisfied then we look for a sell position.
