[Heikin-Ashi Trading Strategy]-Steemit Crypto Academy | S4W2 | Homework Post for @reddileep @azamrai
This is s a great lecture about Heikin-Ashi candle stick pattern. Traders use this candle stick patters for trading purpose. Professor explain this tool very well. At the end of lecture there are few questions that are placed by professor. I try to answer all the questions. I hope you like my method of understanding.

Define Heikin-Ashi Technique in your own words.
Heikin-Ashi is a candlestick pattern that is use to do technical analyses of particular asset. Heikin-Ashi is a technical analyses tool that is use in technical analyses. Candle that is created in this technique is containing the average value of previous candles. Next candle is containing the information about the previous candle. Average data value is considered to make a next candle.
Candles are made in this chart is based on previous open, close, high and low values. Next candle having the average value of all these values. We can say that the direct connection between the previous candle and next candle. We use this technique to know the clear market trend that where market is going on.
Heikin-Ashi uses the average values of previous candle. This is why it display smooth results. For the calculation purpose, there are few formulas are defined. We can calculate open, close, low and high points using these formulas.
Make your own research and differentiate between the traditional candlestick chart and the Heikin-Ashi chart. (Screenshots required from both chart patterns)
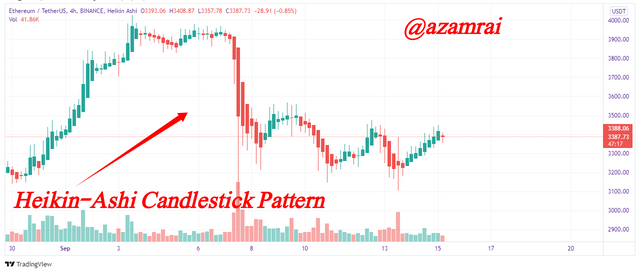
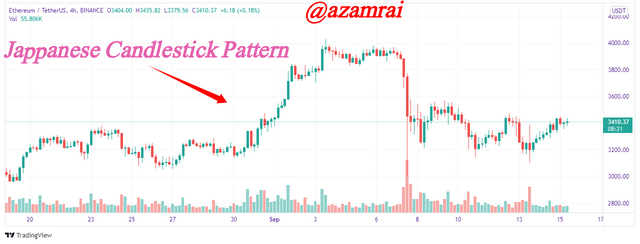
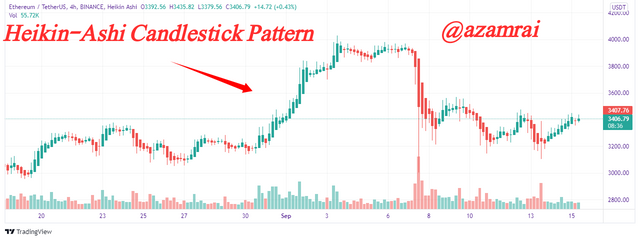
Before going to differentiate we see the graphical representaion of both charts.
This Japanese Candlestick Chart.
Heikin-Ashi Candlestick Chart.
In many cases the Heikin-Ashi candlesticks are different from Japanese candlesticks chart. There are few differences that I mentioned in the table.
| Japanese Candlesticks | Heikin-Ashi Candlesticks |
|---|---|
| Shape of Candle is different. Wicks are presented at the both side of candle. | Wicks are not presented on the both side of every candle. |
| Next candle is not directly connected with previous candle in terms of data inheritance. | Next candle is directly connected with previous candle. |
| Spot a Market trend is difficult than Heikin-Ashi chart technique. | We can easily spot the market trend with this chart. |
| Next candle is made on the market price pattern. | Next candle is made on the bases of previous candle average data. |
| Chart is not smooth because price become change at every moment. It changes the color of candle. Price goes up then color is green otherwise it starts the bearish candle with red color. | The chart is smooth because the next coming candles are made on the baes of previous candle data. Average data is used in making the next candle. |
| If the previous candle is completed then the next candle is start. | Candles are made up on the baes of calculations of previous candles data. |
Explain the Heikin-Ashi Formula. (In addition to simply stating the formula, you should provide a clear explanation about the calculation)
In this question we will the formulas that are used in Heikin-Ashi for calculation. This is very important to know that how the next candle is created by doing the calculation of previous candle Open, Close, High and Low. We will discuss one by one that who they get calculation with formulas.
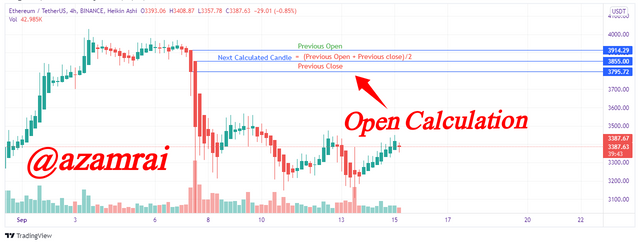
How to Calculate the OPEN
The open is calculated by adding the values of previous candle opening data and closing data and divide by 2. For further Understand I mention the formula here
Open= (open of previous candle + close of previous candle) / 2
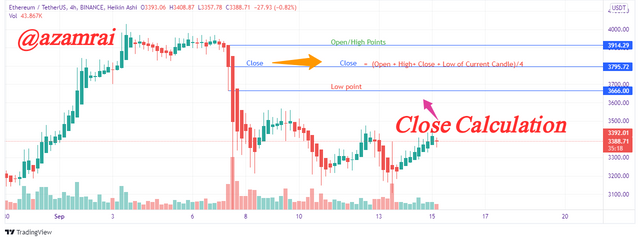
How to Calculate the CLOSE
The Close is calculated by adding the four values open, close, high and low of previous candle. After addition the result is divide by 4. For further Understand I mention the formula here
CLOSE= (open + close + high + low of previous candle) / 4
How to Calculate the HIGH
High is determined by examine the current candle highest point. It can be either positive high point or negative high point. Simply we can calculate with the following method.
HIGH = Upper value of high, closing or opening value of current candle.
How to Calculate the LOW
Low is determined by examine the current candle Lowest point. It can be either positive low point or negative low point. Simply we can calculate with the following method.
LOW = Minimum value of low candle, Open or closing of current candle.
Graphically explain trends and buying opportunities through Heikin-Ashi Candles. (Screenshots required)
We can trace the buy opportunity and sell opportunity by using the Heikin-Ashi technique. Heikin-Ashi candles clearly shows the market trend. But this bullish or bearish trend is not enough for get the more accurate buying and selling signals.
There are many indicators available in market. But the EMA indicator is very comfortable with Heikin-Ashi candles chart. It shows precise results. We can trace best buying and selling opportunity by using this Heikin-Ashi technique with EMA indicator. As all indicators, the EMA in not hundred percent correct. We can use these indicators with our experience. These indicators show the results on the bases of previous price movements.
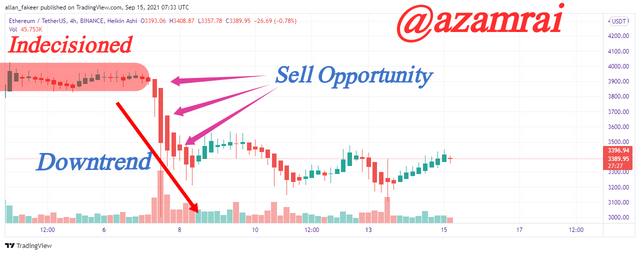
Buy Opportunity
In the following chart we can see that the market is on downtrend. Heikin-Ashi candles clearly show the downtrend market. When red candles are made consecutively on downward then it indicates the downtrend of market. One thing that we should notice that the Wick should present on the down side of candle. It indicates the exact downtrend market.
As know that the buying opportunity is occur when market is on downtrend and ready for trend reversal. At this place I place a buy order. With the help of indicators, we confirm the trend reversal time and place order of buy. In the above figure you can see the place where I make an entry to market.
One more thing that we need to notice is to take an entry after changing the market behavior. In market is in indecissioned form and run side by run then we need to wait for change the behavior. When market change behavior then we place a buy order as shown in figure. Change is observed in one or two candles. Next in the figure we place buy order as mentioned places.
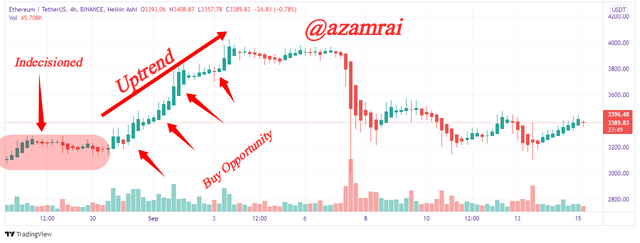
Sell Opportunity
In the following chart you can see that the market is on uptrend. Heikin-Ashi candles clearly show the uptrend market. When green candles are made continuously on upward direction then it indicating the uptrend of market. One thing that we notice that the Wick should present on the up side of candle. It indicates the exact uptrend market.
As know that the selling opportunity is occur when market is on uptrend and ready for trend reversal. Trend reversal is occurred when a particular asset is overbought. At this place we place a Sell order. With the help of indicators, we confirm the trend reversal time and place order of Sell. In the above figure you can see the place where I make an entry to market.
One more thing that we need to notice is to take an entry after changing the market behavior. In market is in indecissioned form and run side by run then we need to wait for change the behavior. When market change behavior then we place a buy order as shown in figure. Change is observed in one or two candles. When market is on downtrend then we need to place sell order as mentioned places.
Is it possible to transact only with signals received using the Heikin-Ashi Technique? Explain the reasons for your answer.
It is not possible to transact only with singnals receiving using Heikin-Ashi Technique. Because, it is not possible to get more accurate sell and buy signal using only Heikin-Ashi technique. There are few reasons for not receiving the accurate results.
- Heikin-Ashi technique is only showing the current market trend it is not more than that.
- We cannot get accurate buy and sell signals with the help of Heikin-Ashi.
- There are many wrong signals occurs in market trend. We can not filter these signals with the help of Heikin-Ashi candles.
So, to get the more accurate sell and buy signal we should use additional technical indicator. These indicators Help us to filter the wrong signals. There are many indicators available but if EMA is an indicator that shows more effective results.
By using a Demo account, perform both Buy and Sell orders using Heikin-Ashi+ 55 EMA+21 EMA.
Buy Order
I used to buy trade with Bitcoin and USD. First all all I open the chart Bitcoin and and USD pair on TradingView. As we know that we can do accurate trade using only Heikin-Ashi candlesticks. So for this purpose I apply the EMA 55 and EMA 21 indication on the chart. As you can see in the figure. I configure the chart and set on 5 min time frame. In the figure we can see that red line cross blue line it indicates the buy signal as you can see in the figure.
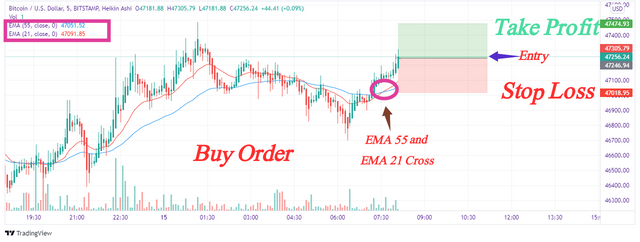
I cannot place a order without risk management. So, I apply risk and reward ratio (1:1). Stop Loss is set on $47018.95. and Take profit is set on $46474.93. At this point a place buy order according to the EMA indicator signal. we clearly see red and blue line cross.
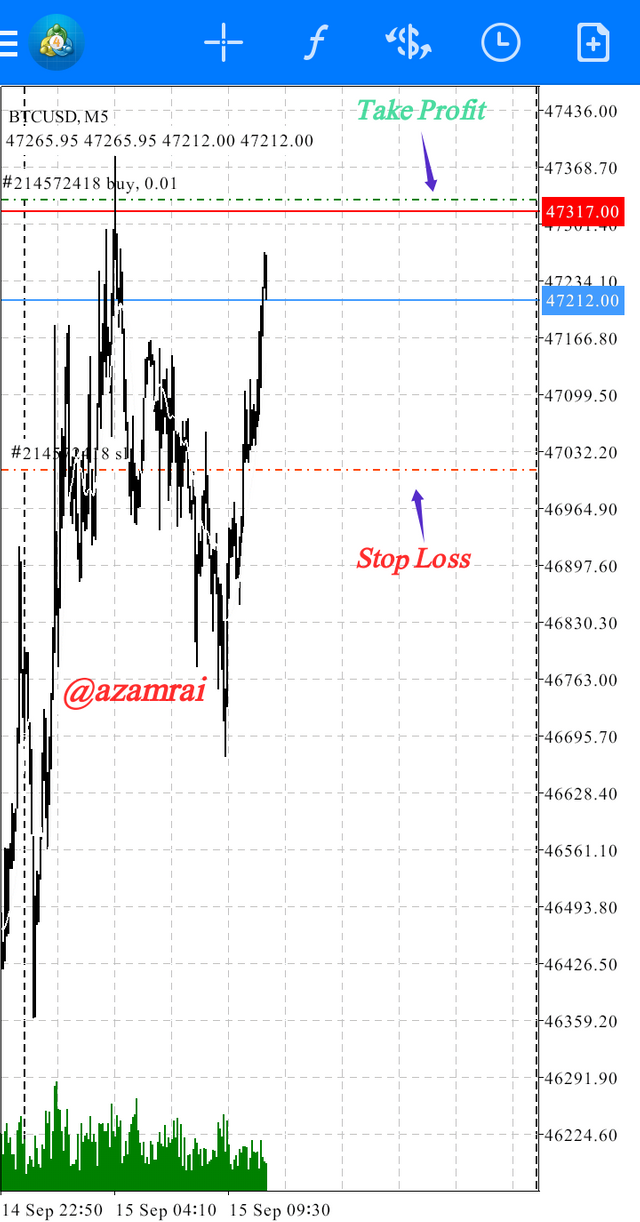
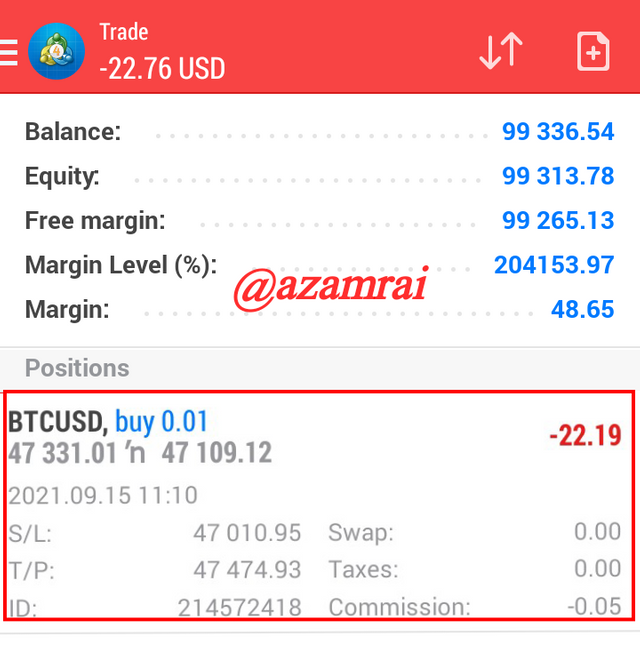
I use Metatrader4 application for doing demo trade. In the above chart you can see that the stop loss and take profit limits are applied in the Metatrader4 chart. And in the following figure you see that our buy order is place at Metatrader4.
Sell Order
For Sell order I choose Zcash and Bitcoin pair. First all all I open the chart Zcash and BTC pair on TradingView. As we know that we can do accurate trade using only Heikin-Ashi candlesticks. So for this purpose I apply the EMA 55 and EMA 21 indication on the chart. As you can see in the figure. I configure the chart and set on 15 min time frame. In the figure we can see that red line cross blue line in downward direction. it indicates the sell signal as you can see in the figure.
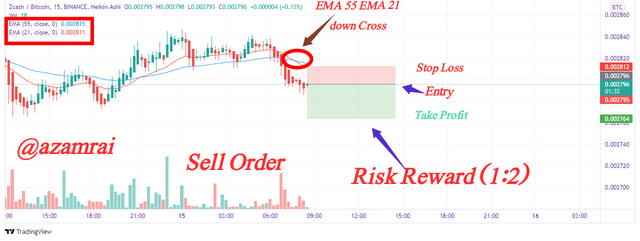
I cannot place a order without risk management. So, I apply risk and reward ratio (1:2). Stop Loss is set on $0.002812. and Take profit is set on $0.002764. At this point a place buy order according to the EMA indicator signal. we clearly see red and blue line cross. I use Metatrader4 application for doing demo trade. In the following figure you see that our Sell order is place at Metatrader4.
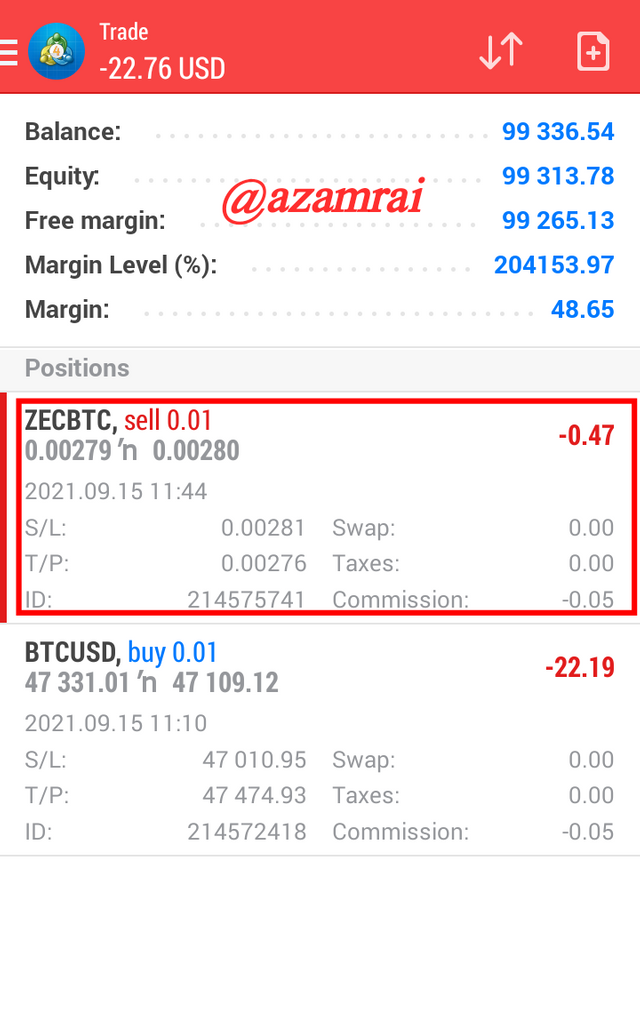
In the above figure you can check both orders are placed. Both orders are placed with SP and TP you can see the above figure.
Heikin-Ashi candlesticks chart is an alternative candle stick pattern of Japanese candle stick pattern. This is another approach to understand the market trend. The four types of data are displayed by these candlesticks. It creates the data abut open, close, high and low. These data are calculated by formulas.
In many cases Heikin-Ashi is better than Japanese candle sticks chat. It is quite simple then other chart. To confirm the current market trend the EMA indicator is used with the parameter of 55 and 21. By the help of this indicator we are able to make an entry and exit from market. This is really helpful in trading.
This patter is use to identify the clear market trend. Using this pattern, we can easily spot uptrend market and downtrend market with the shape of candle sticks. We also identify the not trend in market by spotting the indecision candle.