Crypto Academy Season 3 | Intermediate Course: Crypto Assets and the Random Index (KDJ)|| by @azamrai
This is an outstanding lecture on KDJ indication. I learned enough knowledge about indication. It will help me to do crypto trading in future. For the purpose develop maturity in understanding of indicator, professor place few questions at end of the post. I answer all the question according to required criteria. Let’s start.
What is Random Index indicator explain in you own words. And how it is calculation?
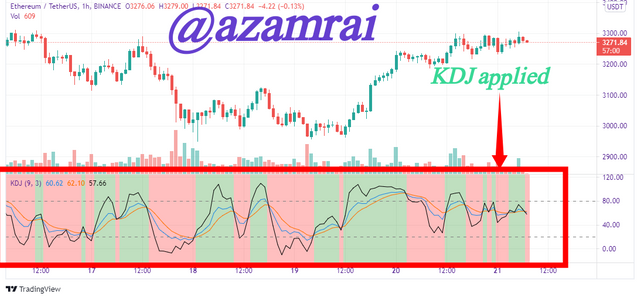
KDJ is an indicator that is applied on the crypto chart in order to do technical analyses. It is applied on the chart, when we want to spot different signals. It is use to observe the price movement of particular chart. When trader enter and exit to market, they analyze the market with the help of different indicators and KDJ is one of them. KDJ is new indicator in market. There are other indicators that look like KDJ. Stochastic oscillator is one of similar indicator. In this following figure you see KDJ indicator on chart how it looks like.
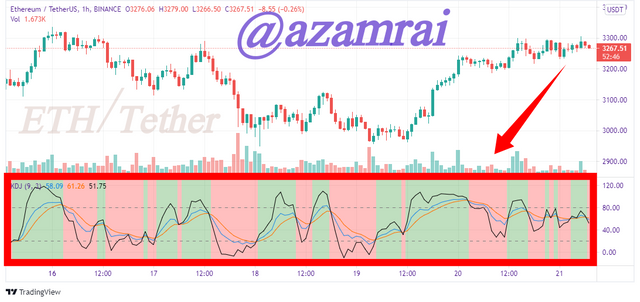
It is use to spot oversold and overbought signal of asset. It is also use to spot the market trend. Sell and buy signals are also indicated by the this indicator. It is very reliable indicator because it has three lines of indicator. These lines are enough to spot any trend. It does not use any other indicator as a combination like other indication ADX.
How KDJ Works?
KDJ has three indication lines. With the help of these indication lines it works. Three lines name as K, D and J. All trends are identified with help of these line. These lines are intercept each other with different angle and with different time frames.
There are three methods to spot the trend. One through line and second is through background color of these indicator lines. And last one is though band value. Next we will understand how these trends are identified with help of these line.
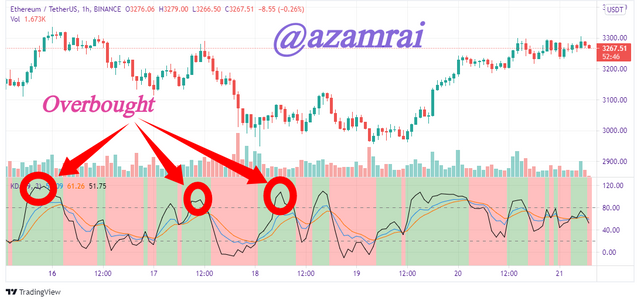
Spot Overbought using KDJ lines
When lines are playing each other and formed in particular shape when J line is spotted on above 80 band. Here market change is shape to downward direction. This condition indicating the overbought signal. Here you see the overbought signal in the figure.
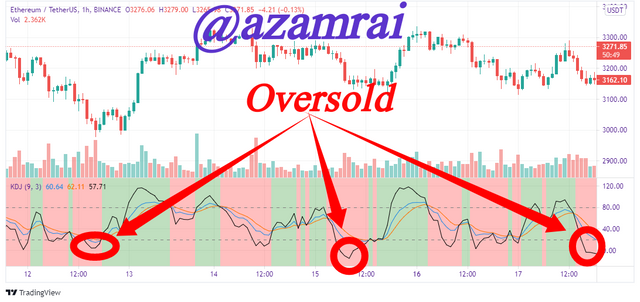
Spot Oversold using KDJ lines
When lines are playing each other and formed in particular shape when J line is spotted on below 20 band. Here market change is shape to upward direction called trend reversal also. This condition indicating the oversold signal. Here you see the oversold signal in the figure.
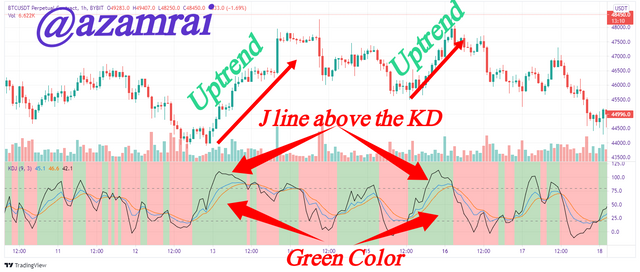
Spot Uptrend using background colour
We can figure out the market trend with the help of background colours of KDJ line. In the chart when black line intercept other two line from bottom to up then background colour of these line are changes as you can see in the figure. Green colour indicates the uptrend as you see in the figure.
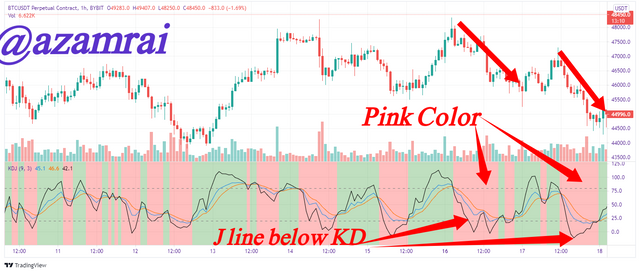
Spot Downtrend using background color
When J black line cross K and D line from up to bottom then background color change green to pink. This pink color indicating downtrend of market and value of particular asset is decrease. When we should note that if color change after black line 80 band interception from up to bottom, then it confirms the down trend of market. Otherwise, it shows false signals. Spotting the downtrend market is shown in figure.
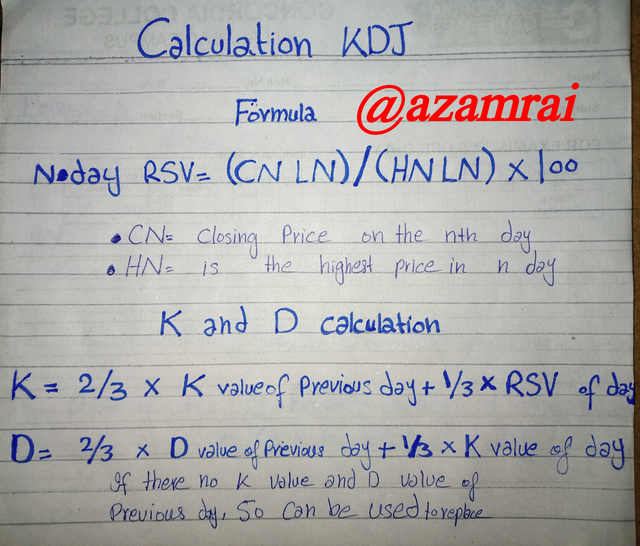
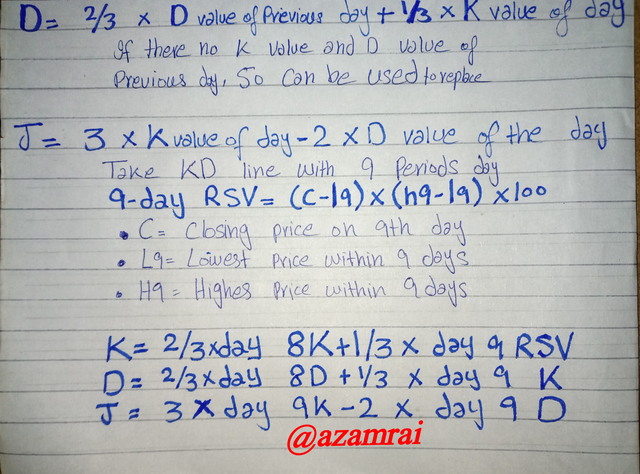
How it is calculated?
KDJ calculation is difficult. When we want to calculate KDJ, first we should calculate RSV value of days and week. Then we calculate the K, D and J values. In the following figure all the calculation procedure are described.
In this way we calculate the KDJ.
.png)
Is the Random index reliable? Explain
Random Index indicator is good indicator for finding the oversold and overbought positions. It has three indicating line KDJ. We can easily spot oversold and over buy signals with the help of KDJ indicator. In this indicator we can easily spot buy and sell signals. We can spot signals with more than one method. We can spot with line divergence. We can spot with changing the color of background. We also spot the signals with the help of bands.
But we talk about the reliability of this indicator then we can say it is reliable. All indicators are reliable when we got the way how to run these indicators. Reliability is dependent on how much technical skill you have. No, doubt few indicators as very easy to use and provide enough information with out holding any technical skill. But reliability is dependent on our technical skill. In my opinion KDJ is a reliable indicator.
How is the random index added to a chart and what are the recommended parameters? (Screenshot required)
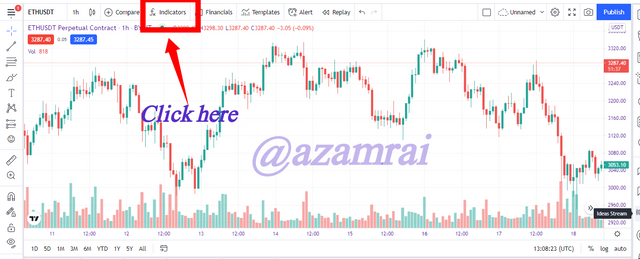
Step:1
- Click on chart button in TradingView
- Click on the fx Button as mention in the figure.
Step:2
- Enter Name of indication here.
- Here enter the KDJ in the text box.
- Click on the first result as mentioned in the figure.
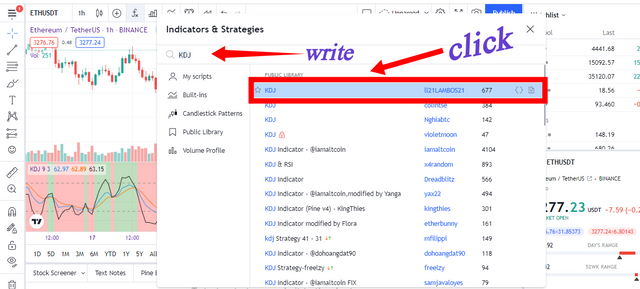
As you can in figure our indicator is inserted successfully.
What are the Recommended Parameters.
In order get better results we recommend few parameters that we should apply on the chart. With the help of these parameters, we can easily spot sell of buy signals. We also spot oversold and overbought signal through these recommended settings.
- Set the periods at 9
- Band side should be 20 to 80
Differences between KDJ, ADX, and ATR
There are numbers of indicators on chart. We use these indicators for technical analyses in trading. If we use these indicators in a right way then we will get good profit through technical analyses by indicators. Here are three indicators like KDJ, ADX and ATR. We will differentiate these three indicators.
| KDJ | ADX | ATR |
|---|---|---|
| It is read as Random Index indicator | It is an abbreviation of Averages Directional Index | ATR Stands for Average True Range Indicator |
| Three indicator lines are present in this chart K, D and J. | There is only one indicator line in it | ATR is also comprised of one line indicator |
| Calculation is done by inserting values in a specified formula | It is not easy to calculation Average directional index | Procedure of calculating the ATR is enough difficult and complex as compare to others |
| It is applied to chart in order to spot when people buy enough and sell enough | It is applied to chart when we want indicate the strength of trend weather is uptrend or downtrend | When we want to know volatility of specific asset then we applied this indicator to its chart |
| It has three lines of indicator that help to indicate signal, it does need any other indicator | it has only one line indicator that is not enough to indicate the strength of trend so, it used with the combination of DI+ and DI- indicators to spot the strength of trend | Alone it is not enough to spot volatility. It is also used with the combination of DI- and DI+ indicators |
| The recommended parameters setting is Nine periods and 20-80 bands | Recommended parameters are fourteen periods and 30-70 band | Fourteen periods with 30-70, DI+ and DI- are recommend |
Use the signals of the random index to buy and sell any two cryptocurrencies. (Screenshot required)
I made this post at the end of this Weak So, I have no time for spot buy and sell signal and buy the assets. It is rarely happened when you found your required situation in chart. It takes time, in this time market formed in particular shape and we spot the signals.
In this question I try to explain when we buy asset and when sell our asset. Let’s start.
1. Buy Order
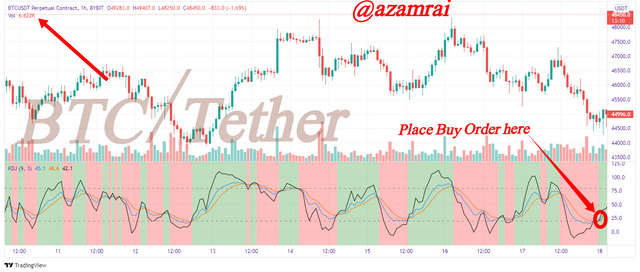
I want to buy BTC with USDT. For this purpose, I apply KDJ indication on this chart. At the extreme right side of indicator chart, you can see J black line intercept Orange and blue KD lines at 20 band. In interception indicates that market is going to up. So, here I place Buy order of BTC. In this way you see how we spot the buy signal with KDJ indicator in the figure.
1. Sell Order
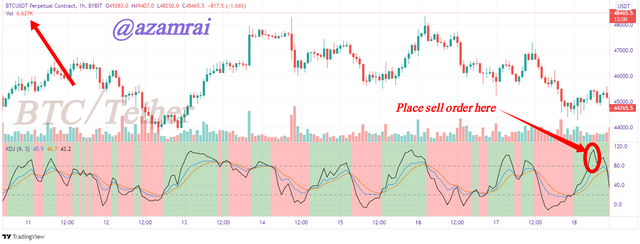
Here I wait for the condition when J (black Line) goes up and cross the 80 band. When market is on uptrend, the black line should be above the orange and blue lines. Here you see in the figure when black line intercept 80 band after that it try to cross KD lines from up to bottom. In is an indication of sell signal. So, here I place sell order of BTC
2. Buy Order
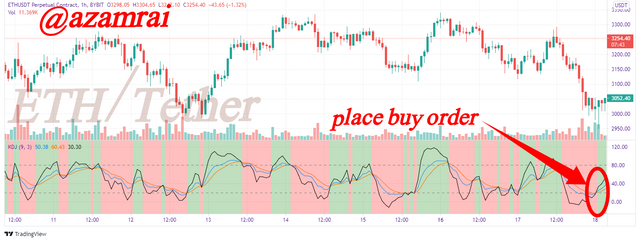
I want to buy ETH with USDT. For this purpose, I apply KDJ indication on this chart. At the extreme right side of indicator chart, you can see J black line intercept Orange and blue KD lines at 20 band. In interception indicates that market is going to up. So, here I place Buy order of ETH. In this way you see how we spot the buy signal with KDJ indicator in the figure.
2. Sell Order
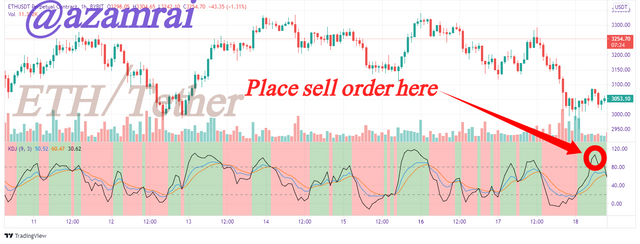
Here I wait for the condition when J (black Line) goes up and cross the 80 band. When market is on uptrend, the black line should be above the orange and blue lines. Here you see in the figure when black line intercept 80 band after that it try to cross KD lines from up to bottom. In is an indication of sell signal. So, here I place sell order of ETH. In this way you see how we spot sell signal using KDJ indicator.
In this way we can see how we use KDJ indicator for buying and selling crypto. By using this indicator we can easily spot buy and selling signal and also spot overbought and oversold signals in chart. this indicator is very helpful to take profit from market.
KDJ is good indicator to spot overbought and oversold signal. It is very helpful in spotting the uptrend and downtrend market with several methods. I think it is better than ADX and ART indicators because, it has three indication line it does not need any other indicator combination to spot trend. If we use this indication after having the basic technical skill then we will earn good profit after doing trading. All the time reliability is dependent on our technical skill. Overall, this is good lecture on KDJ indicator.
Good job @azamrai!
Thanks for performing the above task in the eighth week of Steemit Crypto Academy Season 3. The time and effort put into this work is appreciated. Hence, you have scored 7.5 out of 10. Here are the details:
Remarks
Overall, you have displayed a good understanding of the topic. You have performed the assigned task excellently. However, you did not provide the screenshots of the configuration parameters of KDJ indicator in task 3 and you did not provide screenshots of your demo account summary in task 5.
That said, this is good work. Thanks again for your contributing your time and effort to the academy.
I really thankful to you professor @asaj, I will keep my deficiency in mind next time.