Crypto Academy Season 03 - Week 08 | Advanced Course - Trading Sharkfin Pattern || by @azamrai
This is great lecture by professor on Trading Sharkfin Patterns. In this lecture we learned about Sharkfin patterns that how this pattern is used in trading. How we can trade with sharkfin patterns. Professor given few questions for the better understanding. I try by level best to answer all the questions. Let’s start.
What is are Sharkfin Patterns, Explain Sharkfin Patterns. Give Examples (Clear Charts Needed)
When market of particular asset is quickly moving down then is same way market come back with same behavior to uptrend; as the result the price movement of particular asset make a V on the chart. This V actually called a Sharkfin pattern.
This pattern is made on both side of market, even market is on uptrend or downtrend. If we spot downtrend Sharkfin pattern in a right way then we will get good profit. In the same if we caught the uptrend Sharkfin pattern in correct way then we will avoid loss and sell our asset before market reversal.
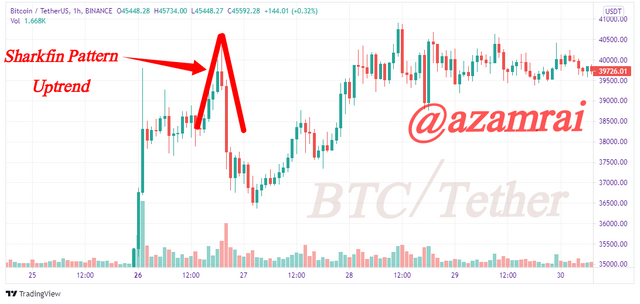
Example of Uptrend Sharkfin chart Pattern
As you see in the chart of BTC/USDT, the market price of BTC is moving up quickly. This is an uptrend Sharkfin pattern. In this pattern the price of BTC is going up. In the same order the price movement is going down after make a height. As you see in the chart Shape of V is made on the chart.
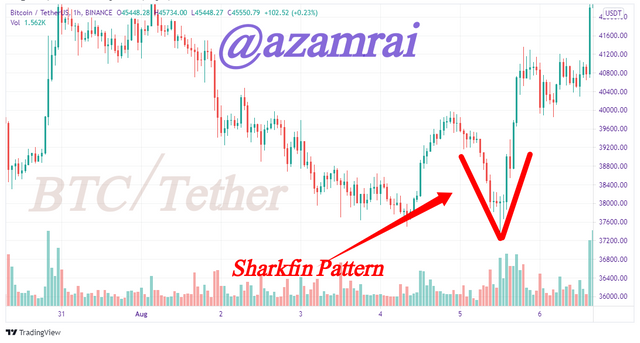
Example of downtrend Sharkfin chart Pattern
As you see in the chart of BTC/USDT, the market price of BTC is moving down quickly. This is a downtrend Sharkfin pattern. In this pattern the price of BTC is going down quickly. In the same order the price of asset is going up. As you see in the chart Shape of V is made on the chart.

How to spot sharkfin with help of RSI indicators? (Clear Charts Needed)
While we are doing technical analyses of a specific coin chart, we use different indicators to confirm the trend. In order to confirm the chart pattern, we use different indicators. In the same if we are going to analyse the Sharkfin patterns then we need to add an indicator that confirm the trend, whether it is right or wrong trend.
So, we need to add an indicator to chat in order to spot the right trend. For this purpose, we should add RSI indicator in the Sharkfin pattern to confirm the pattern. RSI is indicator produced good results in the Sharkfin pattern chart.
Like other indicator we add RSI indicator by clicking the fx button on the top center of chart. Next, we need to enter the name of indicator that is RSI. After selection of RSI indicator, it is added to the chart. We add this indicator on chart with by default settings. We set the RSI setting to 14 periods and change the band setting in between 30 to 70.
Spot Sharkfin Pattern using RSI on uptrend.
We confirm the Sharkfin pattern when the market quickly goes up and again quickly go down and makes the V shape on the chart. Here the thing we need to notice that RSI indicator, if RSI indicator line cross the 70 band on the uptrend and after a while it repeat its reversal.
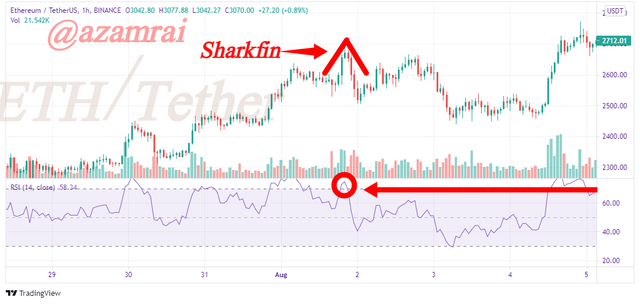
If we observed this situation on the chart then it is a confirmation signal of uptrend Sharkfin pattern. In this chart you see RSI line crosse the 70 band and after a while it comes back. This is a confirm Sharkfin chart.
Spot Sharkfin Pattern using RSI on downtrend.
We confirm the Sharkfin pattern when the market quickly goes down and again quickly goes up and makes the V shape on the chart. Here the thing we need to notice that is RSI indicator, if RSI indicator line cross the 30 band on the downtrend and after a while it repeat its reversal.
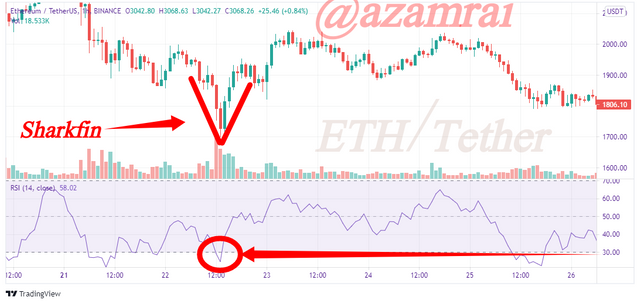
If we observed this situation on the chart then it is a confirmation signal of downtrend Sharkfin pattern. As you can in the chart, RSI line crosse the 30 band and after a while it comes back. This is a confirm Sharkfin chart of downtrend.
How to make entry and exit in market with the help of sharkfin pattern (Clear Charts Needed)
This is major part of this post, how we can use this sharkfin pattern in trading. And how we can avoid loss and make profit using this pattern. We will see how to make an entry to marking for selling and buying.
Entry Criteria for Buying
If we want buy, then we need to follow few guidelines. If we follow these guidelines for buying then we will get profit in future.
- First, we need to add RSI indicator to our chart.
- Set the default settings of RSI to chart like 14 Period, band in between the 30 to 70.
- Take of close look on the chart and wait for quick movement of price to downward.
- If market moves quickly then you need to confirm that it makes V shape on the chart.
- If V shape is formed then next step, is confirmation. We need to confirm the Sharkfin after checking the RSI movement.
- If RSI indicator line cross the 30 band move back up to the 30 band.
- If the above condition is satisfied and confirmed. RSI line above the 30 band, then you need to put the buy order.
Make sure the RSI line is above the 30 band. Because if it is below 30 band and we place a buy order then it is chance to go market further down.
Entry Criteria for Selling
If we want sell, then we need to follow few guidelines. If we follow these guidelines for selling then we will avoid loss.
- As buying First, we need to add RSI indicator to our chart.
- Set the default settings of RSI to chart like 14 Period, band in between the 30 to 70.
- Take of close look on the chart and wait for quick movement of price to upward direction.
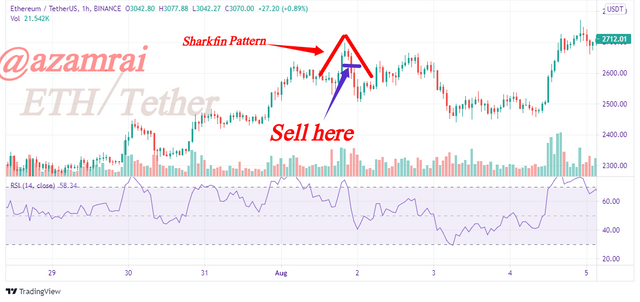
- If market moves quickly then you need to confirm that it makes V shape on uptrend.
- If V shape is formed on uptrend, then next step, is confirmation. We need to confirm the Sharkfin after checking the RSI movement.
- If RSI indicator line cross the 70 band move back up to the 70 band.
- If the above condition is satisfied and confirmed. RSI line above the 70 band, then you need to place the sell order.
Make sure the RSI line is below the 70 band. Because if it is above 70 band and we place a sell order then it is chance to go market further up.
Exit Criteria for Buying in Sharkfin pattern
We should consider few points that help us to take an exit from the market.
- First, we need to put stop loss limit on our trade, this down because market is not trusted, it may be goes in wrong direction against our expectations.
- Stop loss presented at below the sharkfin swing low point.
- Our trade is invalid if the price goes toward stop loss and cross our stop loss limit. In this scenario we should wait for next chance.
- If the price goes toward our desired direction, then we should set take profit level.
- We should set our profit level at 1:1. Which means that (Risk: Reward) our profit level is equal to our stop loss limit. By using 1:1 strategy we can get better profit.
- If the price touches your profit level, then take a profit and make an exit from the market.
Exit Criteria for Selling in Sharkfin pattern
We should consider few points that help us to take an exit from the market.
- First, we need to put stop loss limit on our trade, this down because market is not trusted, it may be goes in wrong direction against our expectations.
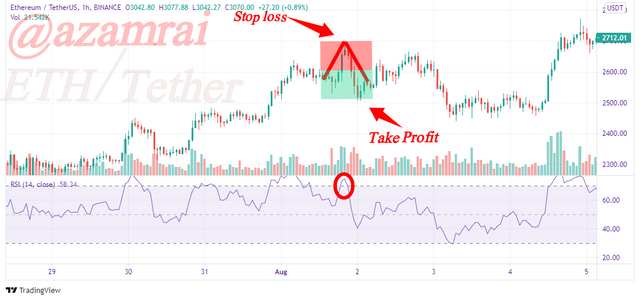
- Stop loss presented at above the sharkfin swing high point.
- Our trade is invalid if the price goes toward stop loss and cross our stop loss limit. In this scenario we should wait for next chance.
- If the price goes toward our desired direction, then we should set take profit level.
- We should set our profit level at 1:1. Which means that (Risk:Reward) our profit level is equal to our stop loss limit. By using 1:1 strategy we can get better profit.
- If the price touches your profit level, then take a profit and make an exit from the market.
Place at least 2 trades as your own using sharkfin pattern strategy (Need to actually place trades in demo account along with Clear Charts)
As we know that sharkfin pattern is shaped in out specific time period of post. But purpose of this task is to understand the sharkfin pattern and take advantages using sharkfin in trading.
First Trade
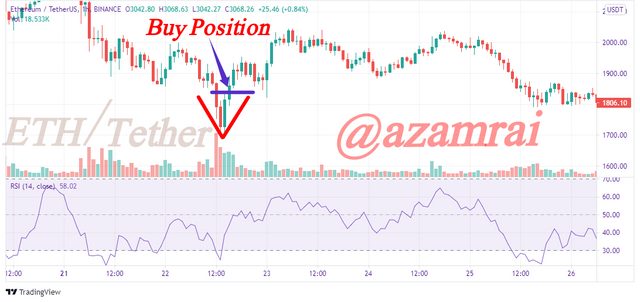
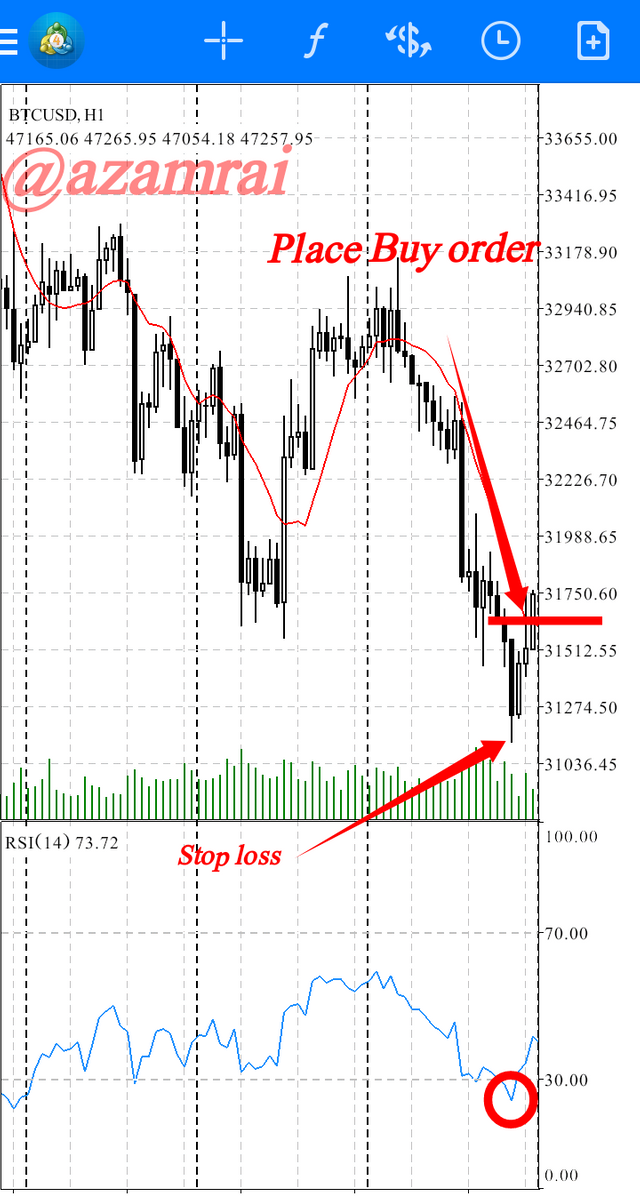
I chose BTC/USD pair for trade on Metatrader4. According to sharkfin pattern buy position is made by price movement going down and RSI indicator indicate that line of RSI also below the 30 Band.
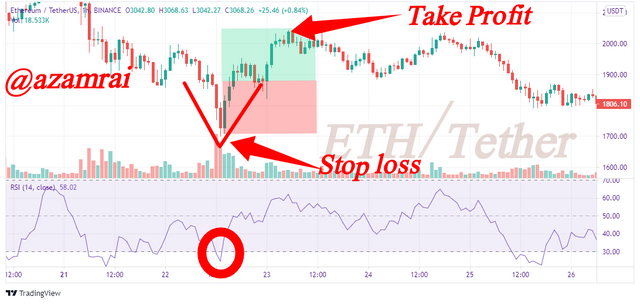
But I place an order when RSI line is slightly up the 30 band. As you can see in the figure the chart values show the RSI movement below the 30 band. But I wait for the movement when RSI grow up slightly and place above the 30 Band. First, I place stop loss limit that help me to avoid loss when market is unexpectedly in wrong direction. Next, I place buy order as you see in the figure.
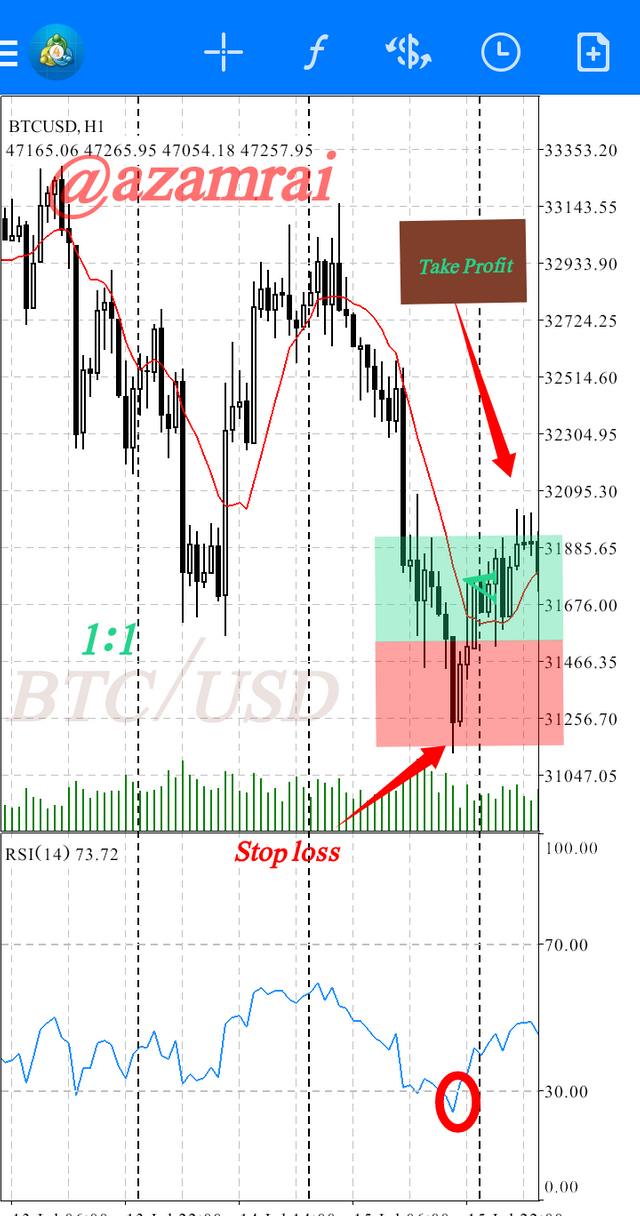
Next is I take profit when market is on bullish. I use 1:1 (Risk: Reward) for profit. When market is equal to 1:1. Here I take a profit from market. Because next movement of market is entering the unexpected area. I take a profit in place that is mentioned in the figure.
Second Trade
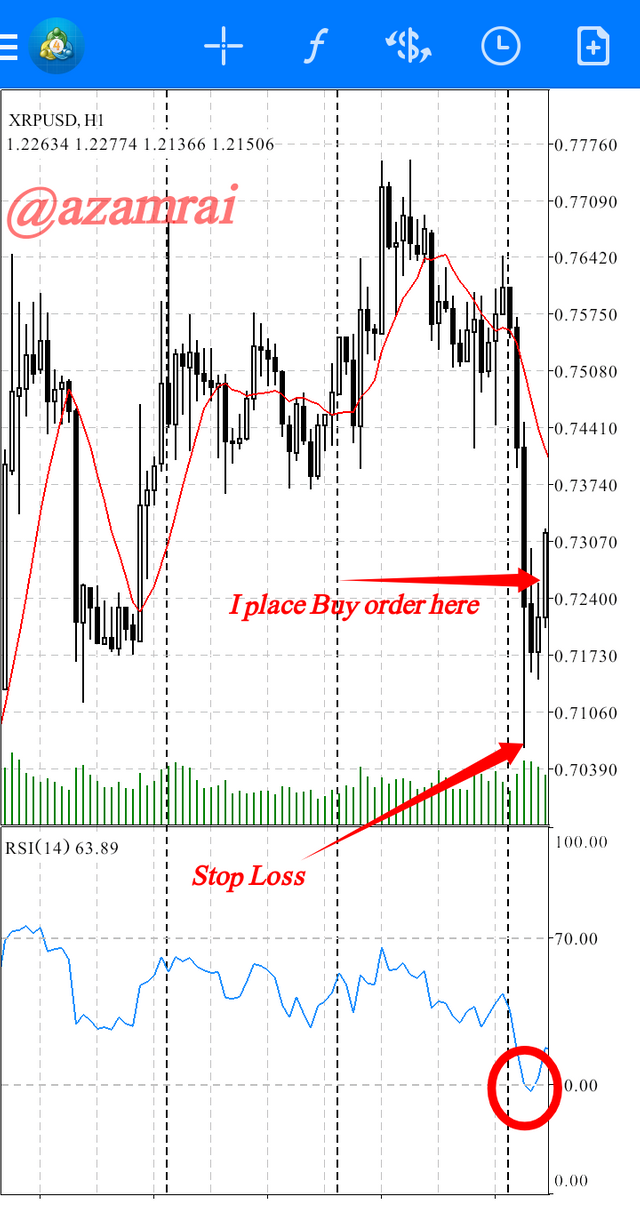
I chose XRP/USD pair for investment using the sharkfin pattern. Here I set the 4h time frame. I observe that market is on bearish. In figure we can see that RSI cross 30 band slightly. This is an opportunity to buy. But I wait for a while because RSI should be on above 30 bands. As it crosses the 30 band, I place buy order as you see in the figure. Stop Loss is also set.
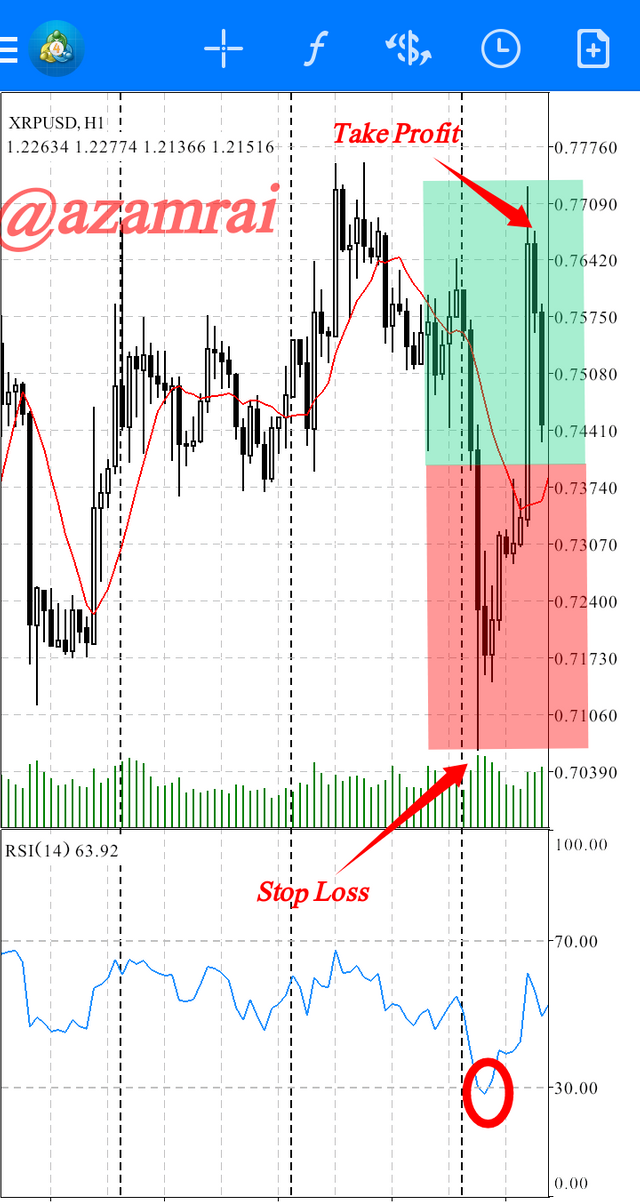
After bearish run market take a big bullish run. Here I use 1:1 ratio for profit. As we can see in the figure if ratio limits are fulfill then I take profit from this place. As you can see in the figure where I take profit using the 1:1 ratio.
In this way we can trading using sharkfin. If we use this pattern with efficiency then it will be more profitable for us in trading.
Conclusion
Cc:
@kouba01
@cryptokraze
Thank you.