"[Rectangle Pattern] - Crypto Academy / S5W4 - Homework Post for @sachin08".


1. Explain Rectangle Pattern in your own word.
2. How to identify Rectangles. Explain with Screenshots.
3. Can we use indicators with this pattern to get accurate results? Explain with Screenshots.
4. Explain Rectangle Tops and Rectangle Bottoms in your own words with Screenshots of both patterns.
5. Show full trade setup using this pattern for both trends. ( Entry Point, Take Profit, Stop Loss, Breakout).
6. Conclusion.
Q1 : Explain Rectangle Pattern in your own word.
Answer :-
Theee patterns are very much influenced by volume. In other words the higher the volume of the asset at a particular time we will observe the pattern going higher.
The Rectangle pattern we observe in the crypto space has two of the horizontal lines, just like the shape however the horizontal line on top is referred to us the resistance whiles the one at the bottom is our support.
Looking at the definition of a rectangle, it can be noticed that a rectangle pattern behaves in the same way. A rectangle pattern is a technical analysis tool which formed on a chart during the short period that the market is ranging or there is no movement.
The horizontal trendlines which I described earlier as being trendlines drawn at the top and bottom can be described as minor supports at the bottom and minor resistance at the top.
the price has an exit from the rectangle pattern phase called a Breakout, and the breakout can be in any direction .
2. How to identify Rectangles. Explain with Screenshots.
The price is first trending in a direction then it gets to a point where the price starts to move up and down in a zig-zag manner without the price moving higher or lower than the zig-zag points, thus forming tops and bottoms.
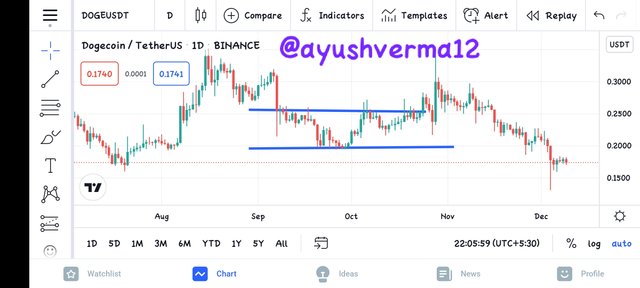
The Rectangle pattern is identified through Price Trend and Horizontal Trendlines.The most important thing which should remain in mind while observing the rectangle pattern in the chart is that the price always moves horizontally between the two trendlines which are the upper resistance line and the lower support line.
The two high points should be of the same level and a space between of which the price action retrace to form a lower point.
Same thing apply to the two low points.the Support and resistance zone multiple times to validate a rectangle pattern, and later breakout occured and a new phase is about to be exstablished.
3. Can we use indicators with this pattern to get accurate results? Explain with Screenshots.
Similarly, if we talk about rectangle patterns, we can use other indicators to strengthen our analysis and increase the chances of our trade success.
The breakout of the rectangle and the moving average happen simultaneously. The Moving Average breakout indicates that the support has been broken, and the price will move in a bearish direction.
Since this is a Top rectangle pattern scenario, we should be looking at an uptrend scenario and hence an observed breakout should be targeted and trade position opened.Such kind of breakout are usually referred to as a minor breakout and this is due to the little break above or below the trendline.
The real breakout often occurs at the direction opposite to the false breakout.Notice how the volume of the price chart gave a bearish trend signal earlier before the actual downtrend in the price chart.
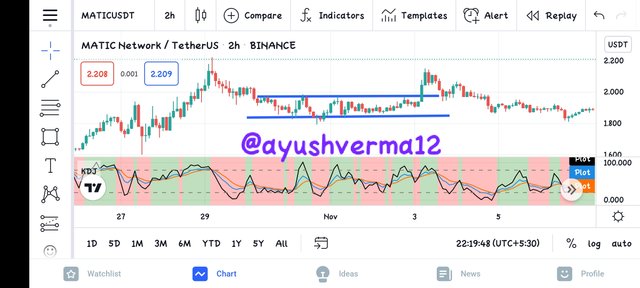
This simply means that using this pattern with other Indicators like the two Indicator which I have use would definitely give us accurate results.
I have used KDJ Indicator in alongwith Rectangle chart pattern through which We can assume the breakout point with the help of KDJ Indicator and we can get accurate entry points.
4. Explain Rectangle Tops and Rectangle Bottoms in your own words with Screenshots of both patterns.
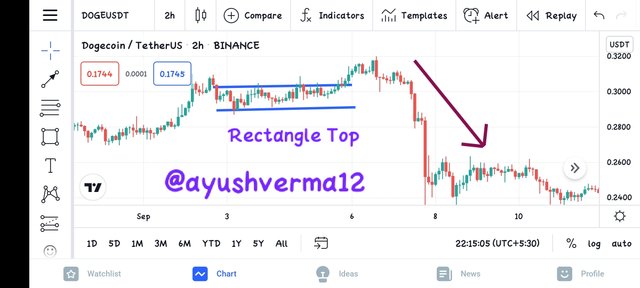
Rectangle Top:- When we talk about rectangle top, we are referring to those rectangle pattern that are formed at the top of the chart and hence the name rectangle top. This is a type of rectangle that is usually formed after a very long bullish trend or up ward movement.
For one to be able to spot a top rectangle, he should be sure to see a bullish movement in price of an asset which may have taken a very long move. The screenshot below is a clear example of rectangle top.
In a rectangle top, price trades between the flat resistance and support ( top trendline and bottom trendline) until it breaks out in the downward direction. The breakout for a rectangle top happens in the downward direction below the flat support line.
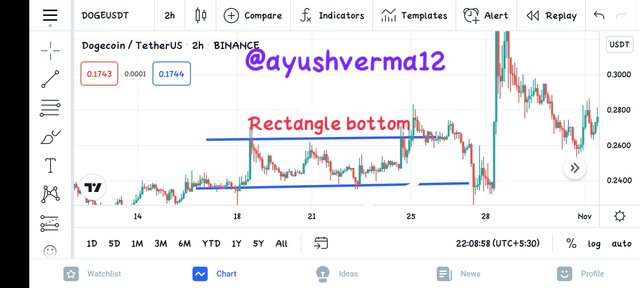
Rectangle Bottom:- When we talk about rectangle bottom, we are referring to those rectangle pattern that are formed at the bottom of the chart and hence the name rectangle bottom.
This is a type of rectangle that is usually formed after a very long bearish trend or downward movement. For one to be able to spot a bottom rectangle, he should be sure to see a bearish movement in price of an asset which may have taken a very long move. The screenshot below is a clear example of rectangle bottom.
The breakout point of the rectangle bottom is always upward meaning the buyers have won the battle. So the price of the assets tends to rise or be in a uptrend. Hence it signals trades to enter into a buy trade.
Make a lot of profits.After the rectangle forms, price trades inside the rectangle between the top trendline A and bottom Trendline B, until it eventually breaks out in the upward direction if it is forms at the base of an uptrend, or in the downward direction if it forms during a downtrend.
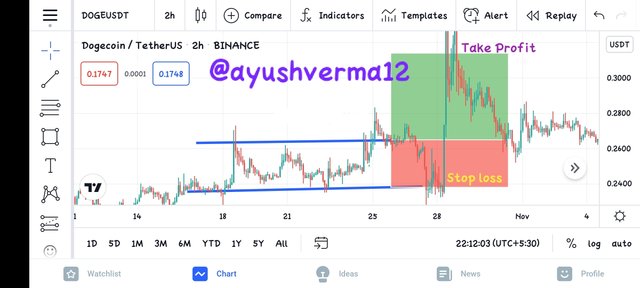
5. Show full trade setup using this pattern for both trends. ( Entry Point, Take Profit, Stop Loss, Breakout).
Rectangle Top is formed after a bullish trend has been formed . in this screenshot you will see that the rectangle pattern formed is touching both horizontal lines, when assist break support line. Then during the consolidation period, there is a shortfall to the support line, halfway there, the candlestick bounces back to the resistance line and crosses it, causing a breakout at the top.As such, the best indicator I apply to this pattern is the Volume and Price Volume Trend Indicators .
Buy Trade Setup.
As from the lecture, We should mark take Profit level after the breakout happens and then we should mark the stop loss level below the support level.
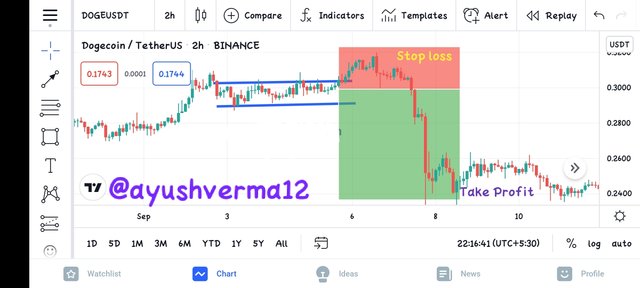
Sell Trade Setup
From the screenshot I have identify the breakout stage on the chart. My take profit and stop loss is also indicated in the chart as it is shown on the screenshot,my top and bottom horizontal lines are all intact and the price of the asset is bouncing up and down.
6. Conclusion
It involves some trading formation which are; spotting the rectangle breakout, identifying your rectangle on a chart, enter you stop loss a the midpoint of the rectangle range, enter your rectangle trade at the point of where the breakout is directed.Traders enter a position after a breakout.
Breakout at the resistance is an indication for a long entry which breakout at the support indicates a short entry. This pattern, though a bit difficult to locate is a very reliable trading technique that can draw a lot of gains to a trader from looking out a taking a trade at the breakout which is usually very significant and massive.
Thank you for this lecture.
Note - All images are taken from TradingView.