Steemit Crypto Academy Season 3 Week 2 - Beginner's Course | Introduction to Charts for @reminiscence01
Hello fellow steemians and members of the cryptoacademy. I appreciate the lecture of our dear professor @reminiscence01.
Below is the answers to the homework given.
Question 1: Explain the Japanese Candlestick Chart? (Chart screenshot required)
The Japanese candlestick chart is a price indicator that appears to reflect merely price movements at first look, but can also indicate market volatility behind price variations, making it a more perceptive indication than most regular bar charts.
The centre region of each candlestick, referred known as the body, represents the distance between the open and close of the security being traded.
The designs are in the shape of a candle, with a head and a tail/shadow/wick connected (the body). The closing and high prices are displayed on the upper half of the tails, and vice versa.
A positive price movement is indicated by a green or white candlestick body, whereas a negative price movement is indicated by a red or black candlestick body. Traders can select their favourite colors to signify bullish or bearish swings on modern trading platforms.
The price difference between the top of the body and the trading period's high is known as the upper shadow. The price difference between the bottom of the body and the trading period's low is the lower shadow.
.png)
Source
Whether a candlestick is bullish or bearish depends on the closing price of the asset. If the candlestick closes higher than it opened, the true body is usually white. The closing price always located at the top and the opening price is located at the bottom of the body
and popularized by a broker named Steve Nison in the 1990s among Western dealers.
.png)
Questions 2: Describe any other two types of charts? (Screenshot required)
Bar chart:
.png)
Source
Are Price charts with bars, it the most frequent and well-understood charts. The opening, highest, lowest, and closing prices for each time period are represented by each plotted bar.
The bars are plotted on a chart with price on the vertical axis and time on the horizontal axis. One-day bars are used in the vast majority of one-year graphs.
The range of a bar is defined as the difference between the highest and lowest pricing. On Liquid, a bar is colored green when the period closes higher than the open, and red when the period closes lower than the opening price.
Other time intervals (periods) that can be represented by a bar chart are 5 minutes, 60 minutes, and 4 hours.
Line Charts:
This style of chart is used to see how cryptocurrency prices have changed over time as indicated by a line. The price chart is based on the current day's close bitcoin price. There are two types of scales that can be used in line charts: linear and logarithmic. The pricing scale is separated into equal sections in the linear chart. The price of crypto is scaled in the log chart based on percent changes, therefore two price changes that are different in absolute value but equal in percentage will be represented by the same vertical shift on the log scale.
.png)
Question 3: In your own words, explain why the Japanese Candlestick chart is mostly used by traders.
Some of the reason why it is mostly used by traders is because;
Traditional bar charts have little relevance on their own, however candlestick charts show far more data about what happened in the market that day. Pattern analysis can be used to assess the possibility of future movement in an equity by looking at its price action through time. Candlestick chart pattern analysis can play an important role in almost any investment strategy with a little experience and familiarization.
Traders At a glance can determine the present situation of the market.
Traders can tell if the markets is rising (becoming bullish) or decreasing (becoming bearish) just by observing at the color and length of a candlestick (becoming bearish).They provide significantly more visual information than typical line charts, displaying the market's high, low, opening, and closing prices all at once.
In comparison to bar charts, Japan Candlesticks provide more comprehensive information about price changes. They show a graphical picture of the supply and demand that drives price action across time.
Question 4: Describe a bullish candle and a bearish candle identifying its anatomy? (Screenshot is required)
Bullish candle:
When the close is higher than the open, it is called a bullish candle (usually green or white)
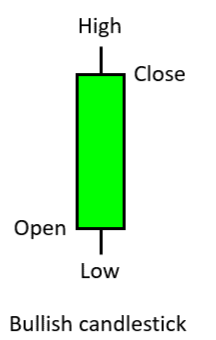
The opening price, closing price, high and low of the day are all included in a bullish candlestick, which represents one day's worth of price data. Whether the beginning or closing price is higher is indicated by the color of the candlestick body. Each time frame chart you're looking at uses the same formula. From 1-minute candles to monthly candles, traders can use candlestick charts.
Other technical analysis tools, including as trend lines, momentum, oscillators, or volume indicators, can be used to validate bullish candle patterns and indicate purchasing pressure.
After a market decline, bullish patterns may appear, signaling a price reversal. They are a signal for traders to open a long position in order to profit from any rising trend.
Bearish Candle:
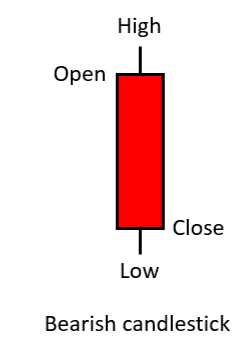
When the close is lower than the open, it is called a bearish candle (usually red or black) and illustrates the price reduction over a specified time period. The high price, opening price, closing price, and low price are the four components of its body (anatomy). In a bearish candle, the initial price is usually higher than the ending price, indicating that prices have fallen at the same time.