Steemit Crypto Academy | Season 3 - Week 3 || Introduction to Technical Analysis of Price Patterns @imagen
Good day everyone, this is my attempt for the homework of @imagen in the season 3 week 3 of the crypto Academy.
1.) Perform the staking on a platform of your choice.
Which platform did you choose and why? Which wallet did you use for the procedure? Use screenshots of your own. How can you link your wallet to the platform you chose? Which coins will you staking with, what is the APY/APR (show screenshots).
Assuming the APY or APR of the coins you chose for staking and the current market value of those coins remains stable, how many coins should you have in 1 year? In US Dollars how much would that amount of coins equal?
I want to use the pancake swap for this task 1 and the reason for choosing pancake swap for the staking process is that it is very secure and secondly, the process of staking on this platform is easier. I also prefer staking with pancake swap because it is easy to connect with Trust wallet.
For this task, I will be using trust wallet.
How to connect Trust wallet with Pancakeswap
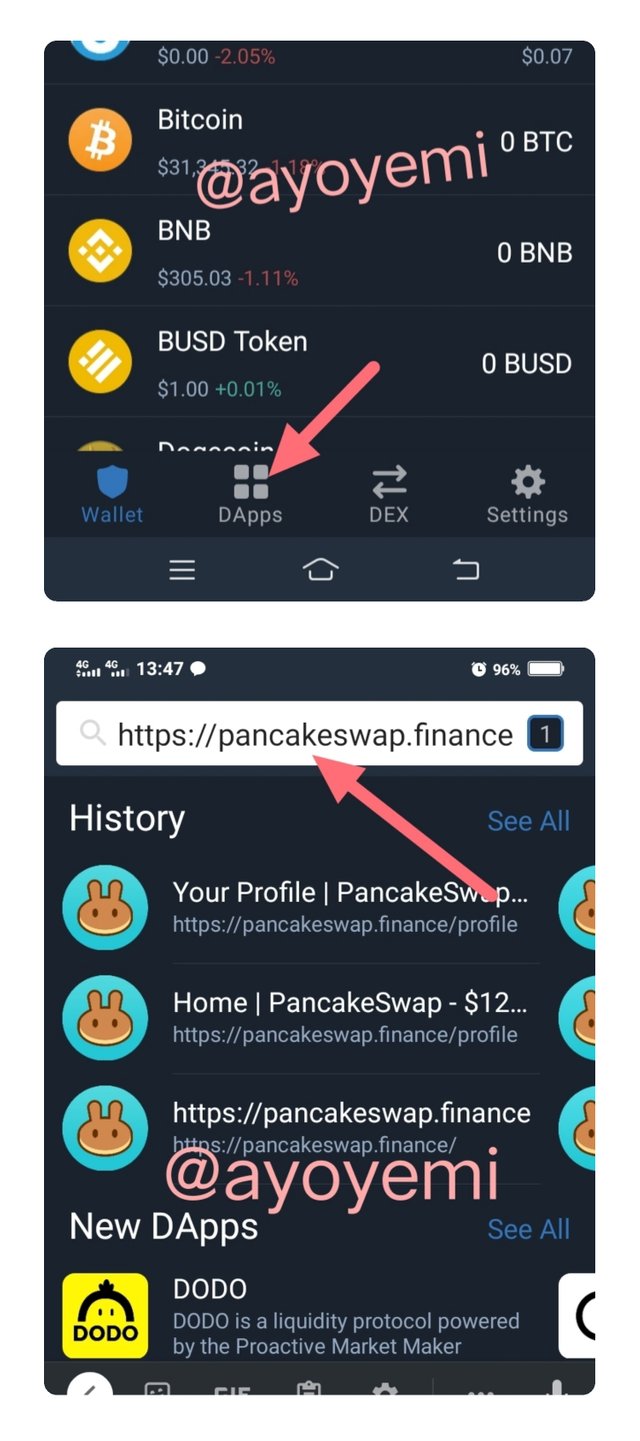
Step 1: Open the trust wallet and click on the DApps icon as shown below. Then you will type the site for pancakeswap on the search button provided.
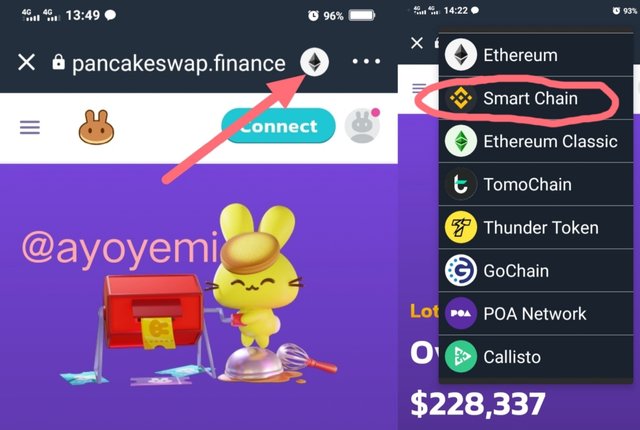
Step 2: After you have been taken to the Pancakeswap.finance, you will click on the wallet icon beside the search space at the top right to change to the wallet you want to connect. In my case Smart chain. See the screenshot below
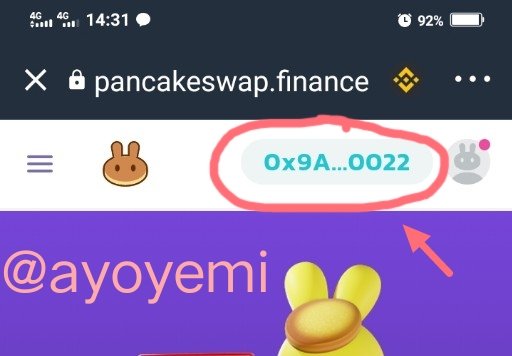
Step 3: My wallet is connected as shown below

Which coins will you staking with, what is the APY/APR (show screenshots).
I want to stake with TRX, I will show the process below.
Step 1:
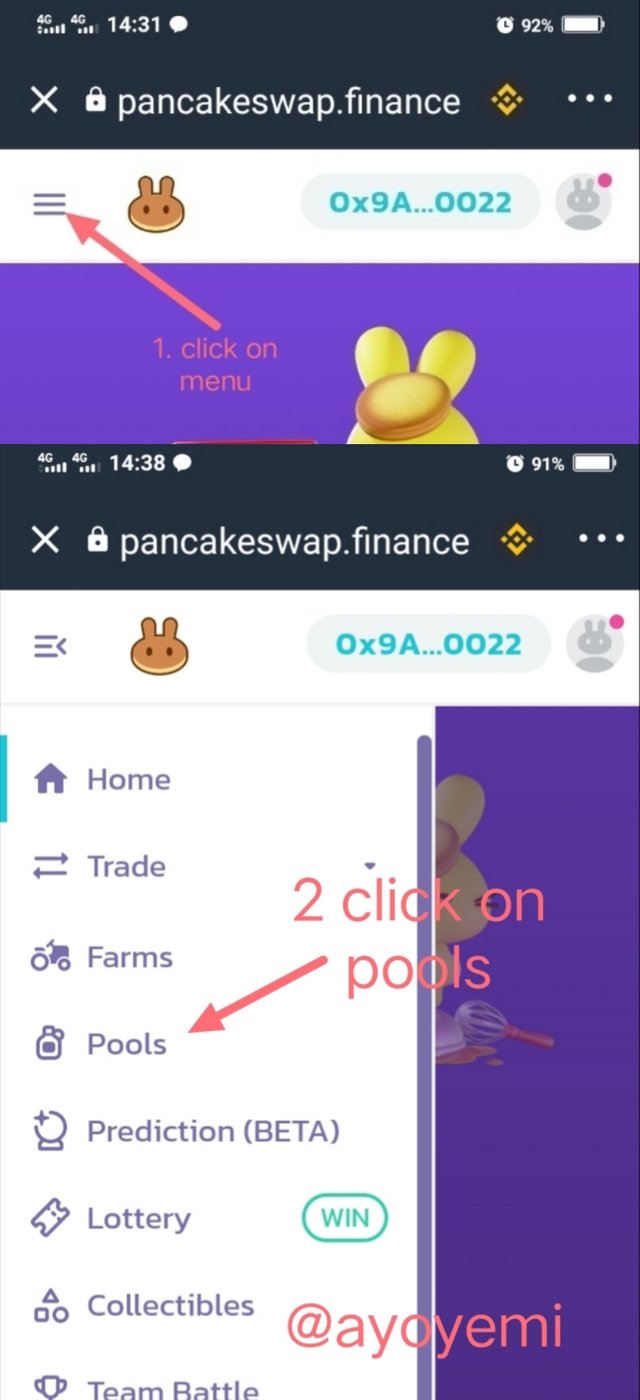
From the menu of the pancakeswap page where we have connect our wallet, we will click on the menu as shown in image (1) below and we will look for pool from the menu and click on it as show in the image (2)
Step 2:
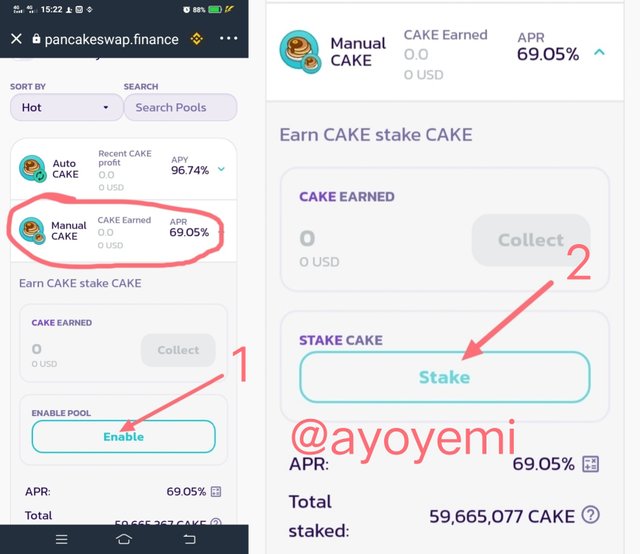
(1) To look for the coin to stake, in my case, manual Cake staking and click on enable.
(2) The information for the staking is displayed and if you are satisfy with it, we will click on "Stake"
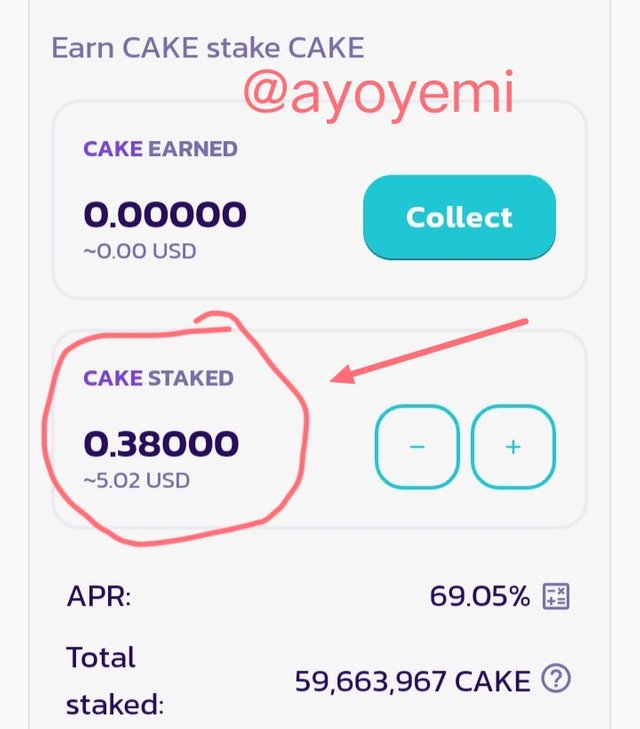
- The 0.38 cake had been staked successfully and the reward will start coming as at when due at the APR of 69.5%
Assuming the APY or APR of the coins you chose for staking and the current market value of those coins remains stable, how many coins should you have in 1 year? In US Dollars how much would that amount of coins equal?
APR = 69.5%
Amount of Cake staked = 0.38 Cake
Amount staked in USD = 5.02 USD
Interest on Stake will be 69.5% × 0.38
= 0.2641 cake in a year
My total Cake in a year will be = 0.38 + 0.2641= 0.6441
The Amount in USD as at now is 13.210 x 0.6441 = 8.5 USD

2.) Pick 3 cryptocurrencies and perform a 7-day and 30-day technical analysis. Draw trend lines and describe whether the coins are in a continuation or reversal pattern. Take screenshots.
In this task, I will pick BTC, TRX and ETH
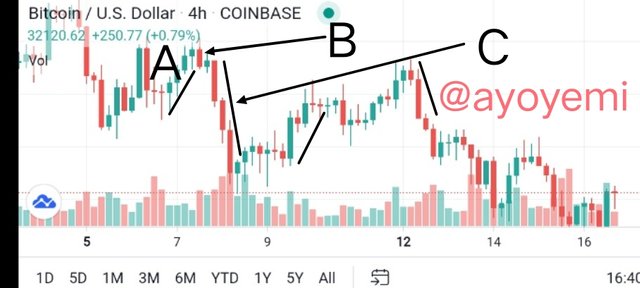
7-Days Technical analysis for BTC
The technical analysis below for 7 Days BTC shows a price high movement (uptrennd) at point A. At point B there was price reversal which leads to the downtrend in price at Point C in the Graph below.
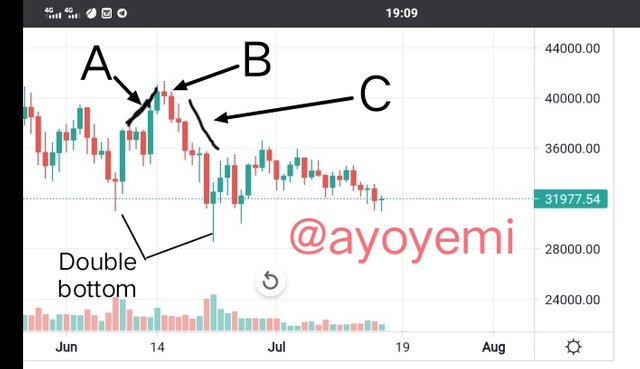
30-days Technical analysis for BTC
The 30-day BTC analysis below shows the Uptrend and downtrend in price at point A and C respectively creating The head at point B
7-Days Technical Analysis for TRX
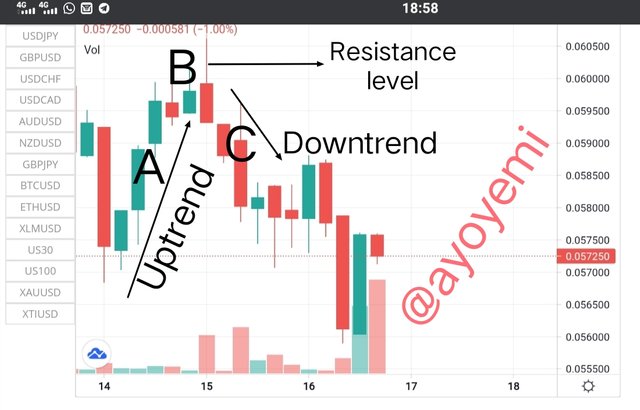
As seen from the chart above, the market of TRX went uptrend and it faced a resistance at point B which caused a trend reversal. It was later supported when it reached a certain level.
30-Days Technical Analysis for TRX
Starting from a resistance that took place at the Point A which led to the bearish trend and the price sank until it met another resistance. From this point the market experienced the bullish Uptrend till point C where it faced a resistance that brings a trend reversal to a downtrend till date.
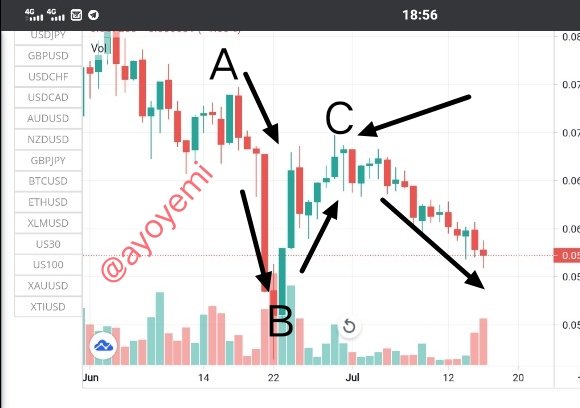
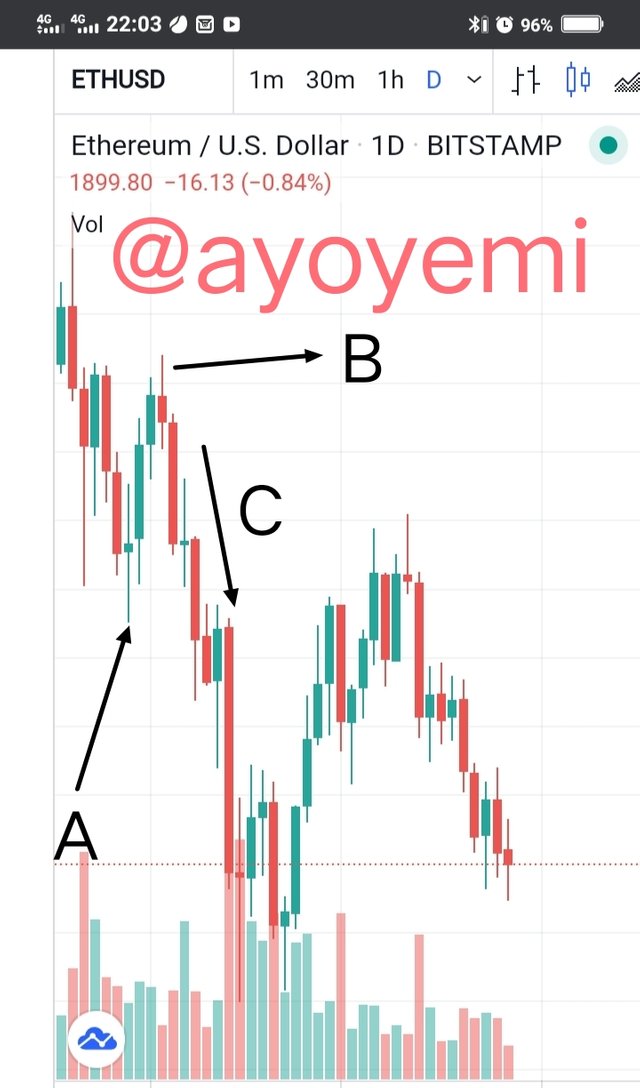
7-Days Technical Analysis for Eth
From the graph below, we can see the Support levels at point A. At point B is a resistance that led to a downtrend in price as it is shown in the graph. Point C is indicating the two tops pattern.
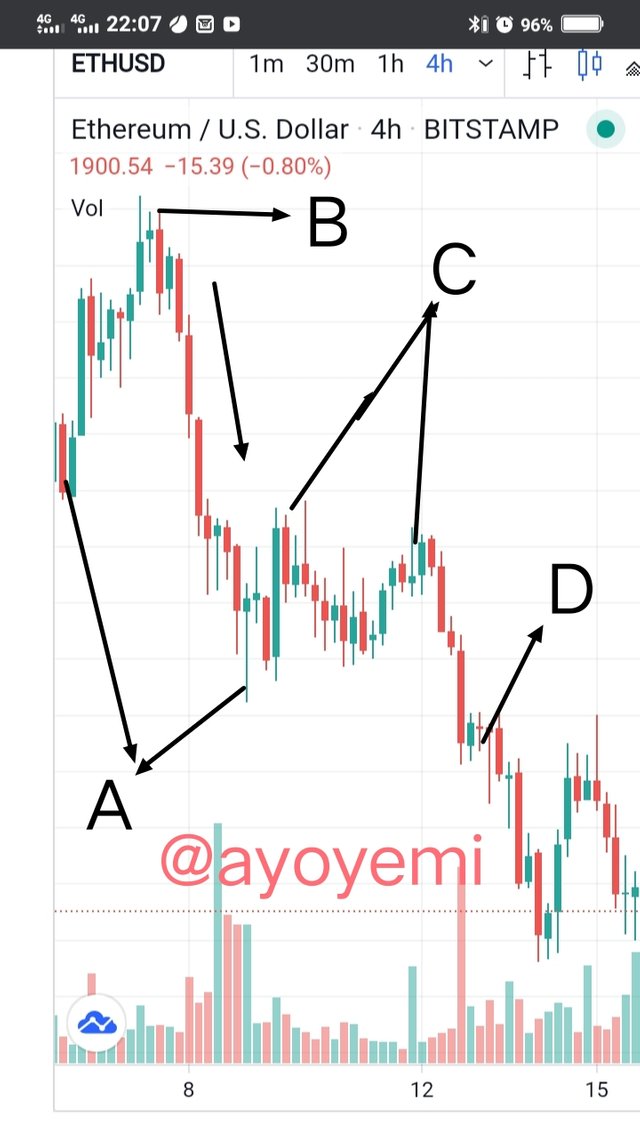
30-Days technical Analysis for Eth
In the graph below is the analysis of Eth from 14th June till 15th July 2021.
At point A is the support level which leads to an uptrennd until it reaches the resistance at point B which also leads to the down trend at point C
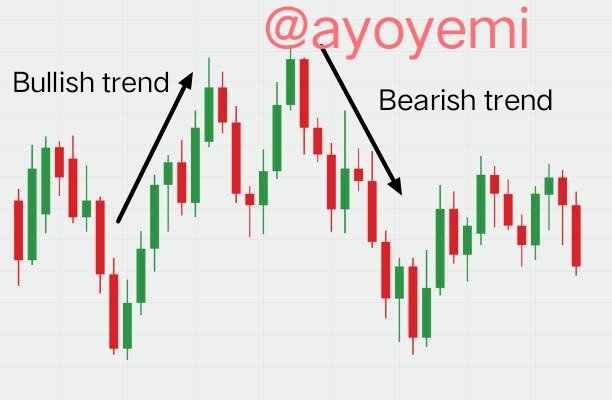
3.) How can we differentiate a bearish season from a bullish season in the market?
Bullish Season
This is when the price of a financial asset has been rising for a prolonged period of time in a market. The phrase comes from a bull's movement on its victim. Buyers use their capital to drive up the price of assets or cryptocurrency, just as a bull uses its horns to dredge up its prey.
Investors are overly optimistic during a bull market and this is when we will say that the price of an asset is bullish.
Bearish Season
This is when the value of a financial asset continues to fall in a market. A asset continuous drops 20% or more, according to several financial platforms and publications, is regarded to be in bearish season. It's also no surprise that a bear is chosen as a symbol for a bear market because when a bear attacks, it uses its claws to kill its prey. This can be compared to the declining of cryptocurrency prices as well.
Other Differences between a bearish season from a bullish season in the market
A bullish market is a market condition where by assets value is going higher in the market while a bearish market refers to a market condition in which the value of most crypto asset is trending downward.
There is considerable demand for securities and limited supply in a bull market. To put it another way, many investors want to buy assets, but only a small percentage want to sell them. As a result of the increased competition for available stock, share prices will rise.
In a bear market, on the other hand, more investors are hoping to sell their assets than to acquire. As a result, share prices fall since demand is much lower than supply.
CONCLUSION
Staking is a means of income whereby your assets continues to work for you and you will be getting the interest as at when due.
Staking is adopted by investors who wanted to profit from crypto mining without risk or hefty input costs. Pancakeswap is one of the platform where we can stake cake and get rewards based in the APY/APR.
From the lecture of. @imagen, I have learnt that Technical analysis is a tool that helps traders to determine the right to enter and exit a particular market for an asset and this makes it very useful and very essential for every traders and those that wish to go into trading
Thank you for participating in the Third Season of the Steemit Crypto Academy.
You made a great effort, however, in the analyzes of the selected cryptoassets, you need to add more information.
Continue to strive, I look forward to continuing to correct your next assignments.