Steemit Crypto Academy Season 5 Week 5 [Beginner's Course] - Trading Using Wedge Pattern
Explain Wedge Pattern in your own word.
Explain both types of Wedges and How to identify them in detail. (Screenshots required)
Do the breakout of these Wedge Patterns produce False Signals sometimes? If yes, then Explain how to filter out these False signals.
Show full trade setup using this pattern for both types of Wedges.( Entry Point, Take Profit, Stop Loss, Breakout)
Conclusion

ANSWER 1.
The function of a wedge pattern is to clarify whether the market will show a trend reversal or show continuation in the same direction, so sometimes it can be complicated. In the previous lectures, we learned Triangle and rectangle formations. It is somewhat similar to that.Wеdgеѕ fоrm in thе dirесtiоn оf thе widеr trеnd, whеthеr thаt trеnd iѕ upward оr dоwnwаrd. Suрроrt and rеѕiѕtаnсе lines converge аѕ a riѕing wеdgе grows, whilе support аnd resistance linеѕ converge аѕ a fаlling wеdgе dесlinе.Its importance can't be overstated as it has often been proven to be a pattern to reckon with when it comes to trend reversals in the foreign exchange.When it forms in an uptrend, it shows that the buyers are taking a break from the market because the bullish effect of traders is not recognized as the price of asset will be seen in a contraction with a little downtrend.
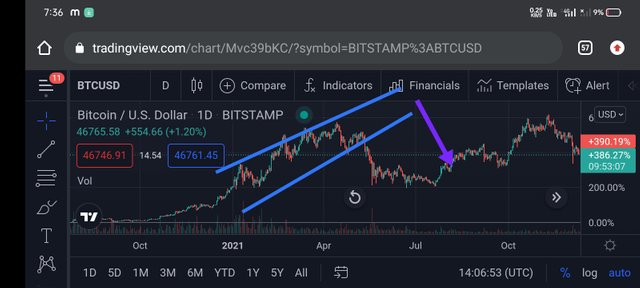
A minimums of 3 touches on one Trendline and a minimums of 2 touched on the others Trendlines. Just likes any others patterns, the Wedges Patterns takes place in both bearish and bullish trends, and they signal for either price reversal or continuation.Importantly, Wedges are typically considered as a reversal Pattern, or at the very least as a formations that could lead to a major retracement in the opposites directions, in the traditional approaches to technically analysis. When's we talk about the wedge's Market mechanics, you'll see why it operates the way it does. If a Wedge occurs on long- term charts, such as monthly charts, it May signals the probability of a long-term reversal.
ANSWER 2.
Rising Wedge Patterns
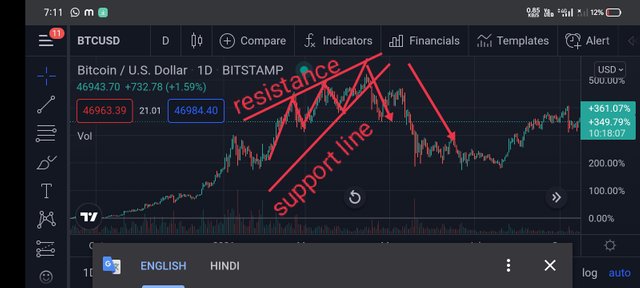
With Rising Wedges, the two converging Trendlines slope in upward direction and there is a later downward breakout.As shown in the chart, the price action narrowed into the two up-slopping converging Trendlines with about 6 touches, and later reversed to bearish at the breakout point.the rising wedge is as well known as the bearish chart which breaks and form the bearish trend which is known as the reversal, to keep the build up of the rising trend, this is build up with fluctuation of the high and low which keep rising and pulling down gets smaller as it gets to the point of reversal or breakout . I have it that the resistance trendline is on top of the price actions while the support trend is below the price actions, there by converging together, at the conjoinment of the two trend line I have a sharp down trend towards the opposite initial direction.The rising wedge is a movement of price in an upward direction or uptrend or bullish direction which after encountering a breakout, the said movement will reverse to an opposite direction I.e movement will change to downward direction or downtrend or bearish direction.
How to Identify Rising Wedge Pattern
Be certain that this trend lines touches at least 5 points for it to be a valid wedge. It can be 3 touch above and 2 touch below. It can also be more than 5 touch but it must not be less than 5 touch.
There must be mutiple touches on the trendline:- For the rising wedge to be valid atleast two to three high trend pattern must touch the resistance and also two or three low trend pattern must touch the support.
Draw a trend line through the swing lows and another one through the swing highs
so first we have to draw two upward sloping lines, where these lines will intersect.
Falling wedge
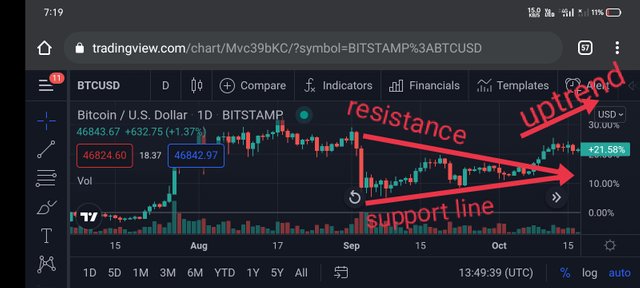
the pattern on the Falling Wedge is seen when the market is consolidating towards a decline with a Resistance line that is steeper than the Support line itself. So, basically the high value or High will always be faster to slope it than the value at its own low (Low).
We can also classify falling wedge as a bullish version of wedge pattern because after a price chart in the market falls in the direction of wedge, there occurs a breakout that leads to uptrend in the price chart.the chart as a result of a reversal of trend from a downtrend chart coagulation of price or as a result of a continuation of a trend when a price tried to make a retracement with formation of a downtrend and continuing in an uptrend there.When I looked at it first time, it looks like a bearish trend, so I thought our lecturer made a mistake, but when I tried to understand it, I discovered it is very correct.the market structure is used and confirmed that it's a downtrend, two lines are drawn above and below the chart making it look like an exposed triangle where the line above represents the resistance while the other represents the support.
identifying and Falling Wedge
Draw two Trendlines, one up, the other down, which touches at least 5 places of the chart.
When we draw two trendlines, the resistance line, and the support line along with the minor highs and the minor lows, so they must move in the downward direction and intersect each other at the bottom end.
Hence there are two projecting sloppy trend lines which move downwards as they converge slowly in order to form the falling wedge.
•Also the price trendline should run at top of the price action and as well under the price action on the barish part.
After identifying the downward slope movement in the trend, you then proceed to sketching two trendline above and below the trending slope where the line save as a resistance and support.
Sketch the line in such a way that, some high touches the resistance and some low touches the support where both line meet at a certain point.
ANSWER 3
when it come to using it signal for analysis in terms of when to enter and exit a trade in other to avoid losses, this pattern sometimes produce false breakout which tends to mislead traders into entering and existing trade in a wrong time, exposing them to losses or less profit, wedge pattern is not excluded in such pattern as it sometime produce false breakout signal.the simple answer here is YES,
For this reason we see that it is particular important to do risk management while trading which is about setting proper stop loss and take profit levels.
Wedge pattern false signals are one of the most essential price action trading patterns to master because they are often a strong warning that price is likely to shift in trend or resume a trend. When the price appears to break out but then quickly reverses, it can be considered a market 'deception,' fooling all those who grabbed the breakout's 'bait.'the best thing to do is wait for the price to close outside of the range for two days ( you could use the formation of candlesticks if you are an intraday trader too )or more is the best approach to ensure you don't get caught in a fake breakout from a trading range.Price reversals can be confirmed when the price of a currency pair crosses the moving average indicator, which can range from simple to exponential.
ANSWER 4
Falling Wedge trade set-up
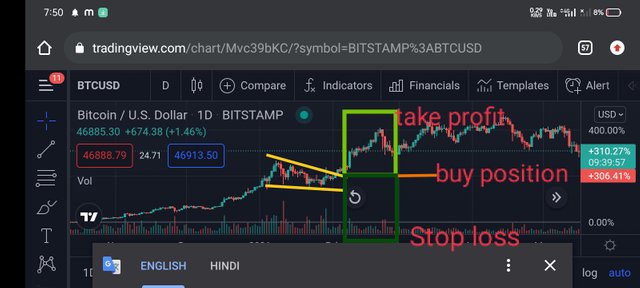
The price on the trend seems to continue to touch the resistance and also touch the trendline support. And after a while it looks like the price will break the trendline resistance.The reversal of the trend is always remains in upward direction which implies that the absolute control of the market is in the hands of the buyers. I have expected to set up a buy entry trade. We have set up this trade because after the breakout in the falling wedge the another thing which will be followed after this is a trend reveral. In the chart, you can see that the two converging trendlines are drawn and the consolidation part ends when the price action breaks through the resistance line and there was a breakout leading to uptrend.
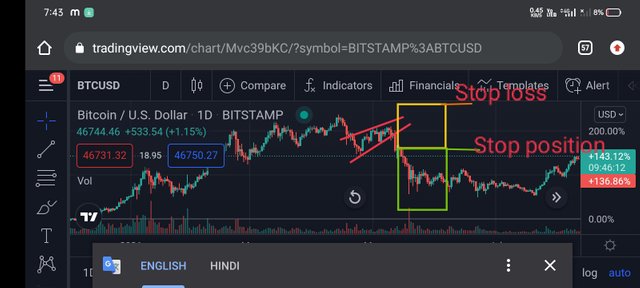
Rising Wedge Trading Setup
It can be noticed that the movement occurs between the Trendlines of the rising wedge pattern. It hits and bounces off the Trendlines until it reaches its apex, thus the end of the bullish period. At this rate, it signals for a trend breakout in which the market shifts to a downtrend. As we know that it’s a bearish pattern so when the price broke the lower line, I shorted the asset with a risk to reward ratio of 1:5. We have to always put the stop loss above the resistance line as the price can bounce after touching it. when the prices have broken from the Wedge, need to make sure to minimize our losses as much as possible if there's going to be any, hence we set out stop loss at a price which is the same as the Higher- high before the breakout or slightly under it.And we also set our entry point after the breakout. We then decide to take our profits at an appropriate price.
ANSWER 5
One must be having good knowledge of this trend before using it to trade. Thanks to the professor for the lecture that made the assignment easier hope I met his expectations for the assignment. Thе time реriоd сhоѕеn iѕ determined by thе time frаmе thаt iѕ mоѕt appropriate fоr bоth lеvеlѕ.the falling aspect in the opposite side where by the formation of the wedge occurs at the downside of the bearish trend which retrace to the opposite direction after the formation of the wedge for the bearish side which is form with two bearish trend lines converging together.To confirm this wedge pattern as I explain earlier it is advisable to add an indicator in other to spot out false signal as pattern sometime mislead traders in a way of showing wrong or false signal.