Estrategia de Trading con el indicador VWAP - Crypto Academy/S5W3 - Homework post for @lenonmc21

Question 1- Explain and define in your own words what the “VWAP” indicator is and how it is calculated (Nothing taken from the internet)?
Answer 1-
If we talk about the motive of day trading, then you have definitely heard of a VWAP short which is used for volume weight average price.
VWAP is considered as an important benchmarks when our motive is at inner day charts which are showcasing some most important criteria regrading a price movement in the short term.
Providing traders with insight into both the trend and value of security. VWAP is definitely a benchmark you want to know and understand as you step into trading.
The use of this indicator is mainly simple and easy as it is similar to moving averages. VWAP Indicator will provide a bullish direction when prices are mainly above the VWAP and bearish direction when prices are in below direction.
What it unique is that it takes into account volume or to your mild trading place eliminating Much of noise that occurs throughout the day helping traders gauge prices as its root the benchmark essentially help you determine whether your entry point is good confirming a trend and guiding you into any decision you make to long or short.
It's volume around average price is appear as a mono line on mainly inner day charts which are similar to like a moving average which looks same. Well, both these two indicators are used for calculating totally different things.
VWAP is calculating the sum of a price multiplied by volume divided by total volume this may sound confusing and makes no sense but once you begin to piece the components together everything will come together in your head to fully understand what you looking at we are to manually create our own VWAP to start begin with the formula.
- Need the average price(5 minutes period)
- Multiply by the volume in that period in that period
- Divide by the volume in that period
Question 2- Explain in your own words how the “Strategy with the VWAP indicator should be applied correctly (Show at least 2 examples of possible inputs with the indicator, only own charts)?

Answer 2-
VWAP stands for volume weighted average price and the reason is such a powerful indicator for day trading it's because it takes into consideration both the volume and the price into calculations in the most general definition.
VWAP indicates a strength of the coin whether there's more buying volume or selling volume. So if a coin is trading above VWAP think it's considered bullish because the majority of the volume are the buyers bit in a coin higher and vice-versa if a coin is trading beneath VWAP then it's considered bearish.
So that's why traders like to use VWAP cross as a trend reversals indicators for them to go long or short.
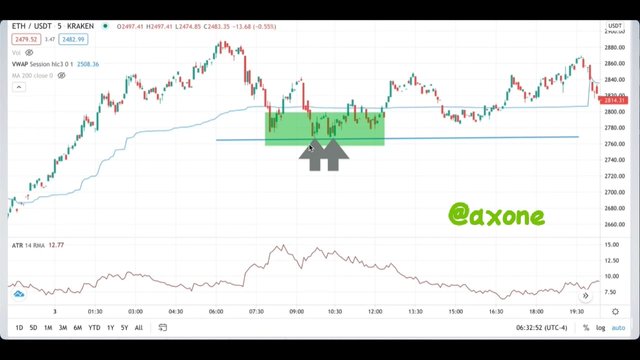
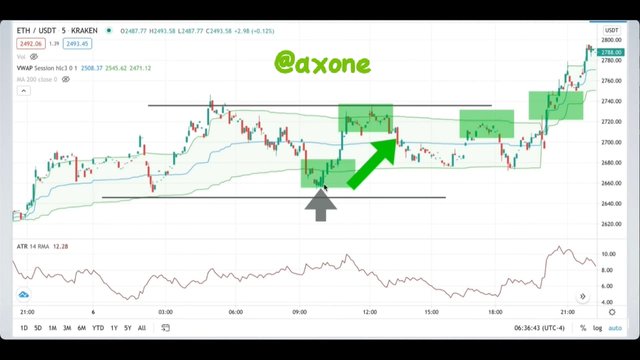
1. VWAP LONG CROSS (BULLISH)
- use with candlestick entry triggers
- see the trend on 5 minute chart (above /below VWAP)
- look for strong support below VWAP
- Anticipate long cross thorough VWAP and / or SMA
- identity trend and price action
- set S/L -use one ATR, or use VWAP, or support and resistance, or risk you are comfortable with
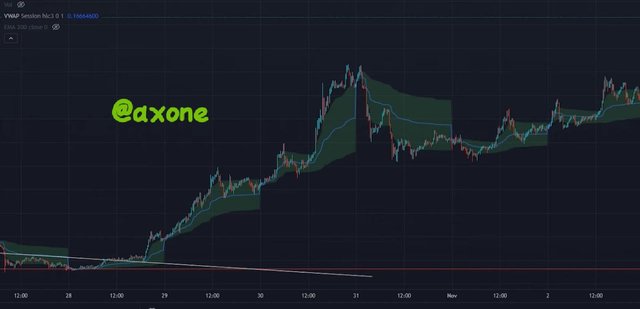
Long cross example :
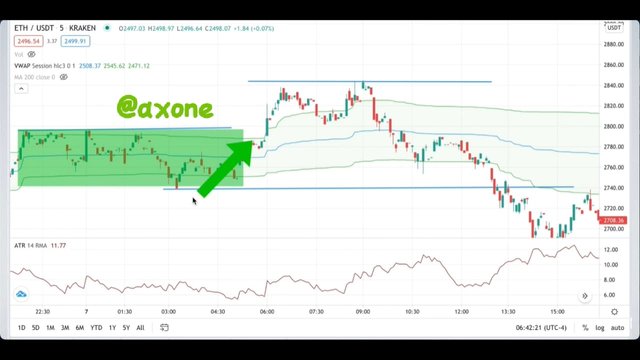
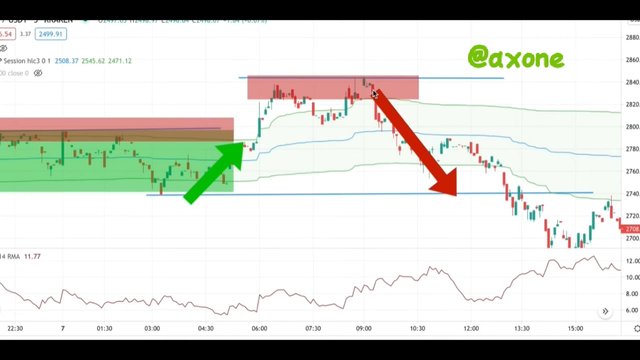
2. SHORT SETUP (BEARISH)
- use with candlestick entry triggers
- see the trend on 5 minute chart (above /below VWAP)
- look for a sell-off through VWAP
- identify trend and price action
- Set S/L - use one ATR, or VWAP, or support and resistance, or risk you are comfortable with
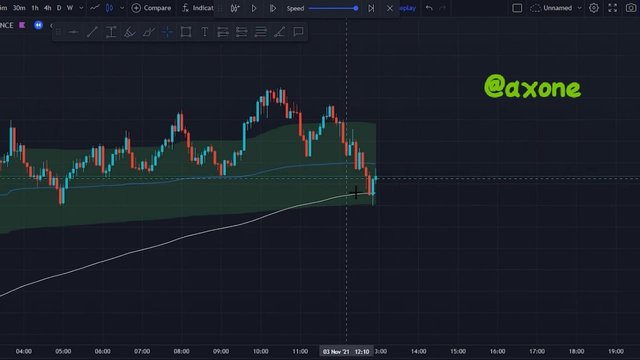
short setup example:
Explain in detail the trade entry and exit criteria to take into account to correctly apply the strategy with the VWAP indicator?
Answer 3-
I'm gonna be showing you a trading strategy that only uses two indicators the pros to this trading strategy is you really shouldn't be holding a trade any longer than one whole day.
This trading strategy can be used from the one minute up to the 15 minute time frame. Now the platform I'm going to be using to show case this trading strategy is trading view.
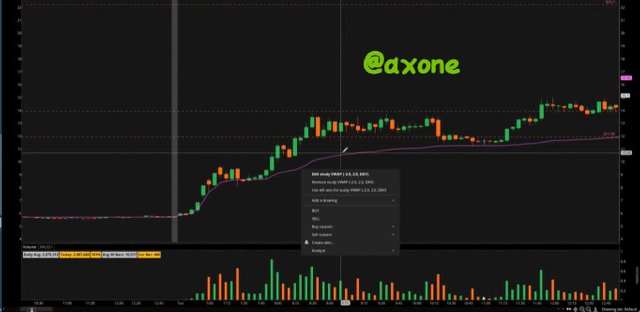
Now to put these indicators on all we want to do is come up to the indicators type in VWAP in the search bar push it once and then type in ema into the search bar as well and push that once and these are the two indicators we need.
Now I'm going to change the settings of the ema to a 200. Now on the VWAP we want to change these settings as well I'm going to take the upper and lower band off. Now we're going to be using our 200 ema as our trend line.
So if price is above the trend line we're only looking for longs and if price is below the ema we're only looking for shorts.
Here we are starting to form an uptrend this price is above the 200 ema this is a great sign and we should be looking for longs.
Now what we want to do is we want to get this price as a discount we want to try and buy in you know somewhere down here on the lower bend if we think price is going to continue up we definitely want to get it on a discount like these.
So during a uptrend we are going to wait for price to come back down. We're really going to be looking for price to fall outside of the lower band.
So price really respecting THIS VWAP it has not been able to break through its middle band okay just here we've had our first touch on the lower band and also the ema so this is still in a uptrend. Now all we're gonna wait for is a signal form price action for us enter this trade.
Question 4 - Make 2 entries (One bullish and one bearish), using the strategy with the “VWAP” indicator. These entries must be made in a demo account, keep in mind that it is not enough just to place the images of the entry, you must place additional images to observe their development in order to be correctly evaluated.
Answer 4-
VWAP indicator is used by institutional brokers these are the people with big money who move the market if the institutional brokers are using it. It is a good idea to keep it on your trading Chart to make profit.
VWAP only works on intraday time frame and doesn't work on daily. If the coin is trading above the VWAP line it is considered as an uptrend similarly if the coin is trading the VWAP it is considered as down trend. VWAP line can act as a support or resistance on a trading chart.
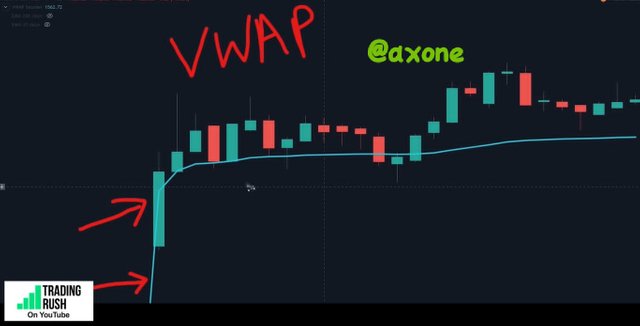
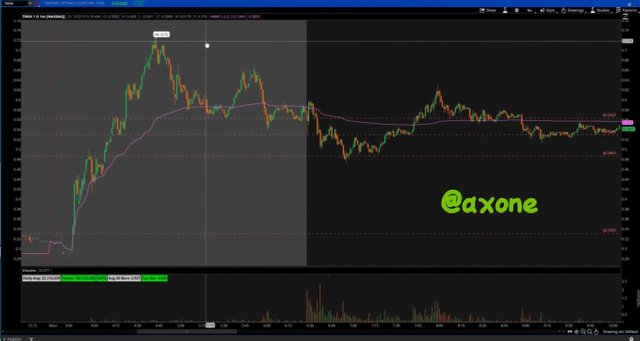
We had an awesome entry that I alerted right off the cents. We used VWAP to our advantage on this trade this was kind of our like one of our main reversal patterns that we play and it is all centered around the VWAP.
So we can see that obviously had a good news release because it spiked up crazy in pretty market and one of the things that I was watching for at open is that I knew that because it had a massive pre market spike it was likely going to have a morning sell-off and you can track that using VWAP.
Conclusion
It was a wonderful lecture comprising of a helpful indicator. VWAP indicator is very helpful and useful in trading and Most traders will surely use this indicator after knowing it's work. I would like to thanks professor as I am able to learn about this indicator through the lecture of professor @lenonmc21.