[Candlestick Pattern] - Steemit Crypto Academy Season 4 - Homework Post for Task 10
1a) Explain the Japanese candlestick chart? (Original screenshot required).
b) In your own words, explain why the Japanese Candlestick chart is the most used in the financial market.
c) Describe a bullish and a bearish candle. Also, explain its anatomy. (Original screenshot required)

EXPLAIN THE JAPANESE CANDLESTICK CHART?
The Japanese candlestick pattern originated in Japan. It is a type of pattern or mechanism that traders use to measure changes in price. This was very successful in the crypto.
When we talk in breef Japanese candlestick pattern is a very popular pattern and is mostly used in trading. With the help of this chart, traders analyze the changes in the market and buy or sell their stocks at the right time with the help of candlestick patterns.
By understanding past patterns, traders read them and predict future price movements.
Trading is mostly linked to past patterns. These can be read by candlestick patterns.
The reason for the success of the candlestick pattern is that it analyzes the previous pattern completely by showing the open prices, the close time prices, the highest reaches and the lowest in that time.
.png)
This candlestick pattern was discovered in the 1700s by a man named Huma. He was a simple rice merchant in Japan and had great knowledge of buying and selling and how many people were buying and also knew how much was in supply.
He was curious to understand the fluctuations in prices and wanted to know the specific reason for those fluctuations. Because as we now know that price is directly linked to supply and markets are influenced by the movements of traders.
It shows candlestick patterns, the movements of traders by representing the size of the candles and by different colors according to the scale. We can set the time frame or duration and view the data that way.
It helps in better predictions and due to the variations provided over time, the stock price can be predicted better.
As we have already discussed that candlestick structure consists of open price, close price, top price and open price.
IN YOUR OWN WORDS, EXPLAIN WHY THE JAPANESE CANDLESTICK CHART IS THE MOST USED IN THE FINANCIAL MARKET.
I think the Japanese candlestick pattern is of great importance in the financial markets for a number of reasons. some of them are;
Timely Decisions: It helps the traders or investors to take the right decisions on time. By reading the candlestick patterns, one can easily understand the fluctuations in the stock prices and also predict what will happen in the future.
The candlestick structure which consists of high, low, open and close price helps the trader a lot to know about the past patterns. By understanding this, a trader can easily invest at the right time
Analysis: Thanks to the Japanese candlestick patterns, this was become a very simple to understand the ups and downs of prices, a trader can understand the entire market in a very short time by reading the candlesticks of the past.
This is made possible by looking at the length and color of the respective candlestick. The candlestick is made up of two colors, red and green. Red color always represents negative price movement and green color always represents positive price movement.
Simply Understandable:- The Japanese candlestick pattern is very easy to understand. It gives a friendly example and helps the trader to understand the past patterns, different prices at different times, the reason for these fluctuations and complete details. By changing the scale, you can get the regulated information at different times
DESCRIBE A BULLISH AND A BEARISH CANDLE. ALSO, EXPLAIN ITS ANATOMY.
BULLISH CANDLESTICKS:-
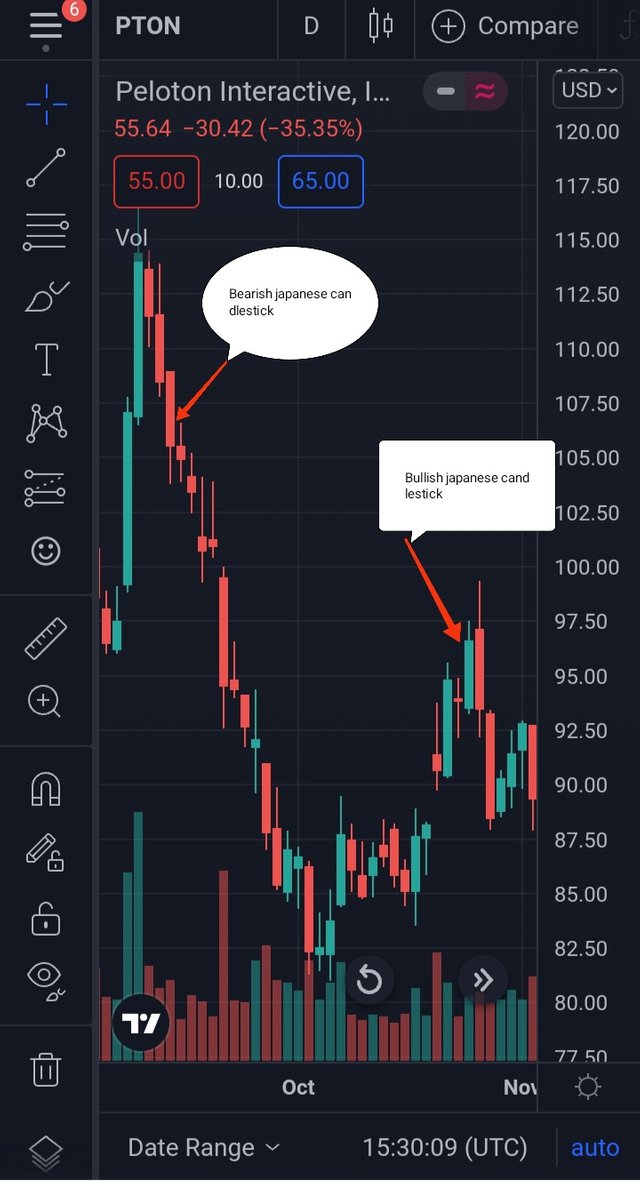
Bullish literally means hopeful, confident or self-assertive. Whereas in the stock market it means that the share price is characterized by rising. Bullish candlestick shows the movement of price movements in the market.
It refers to the relative amount of the price moved in the market by how far it has moved. The bullish candlestick is shown in green. The appearance of a bullish candlestick indicates an increase in the price of the asset.
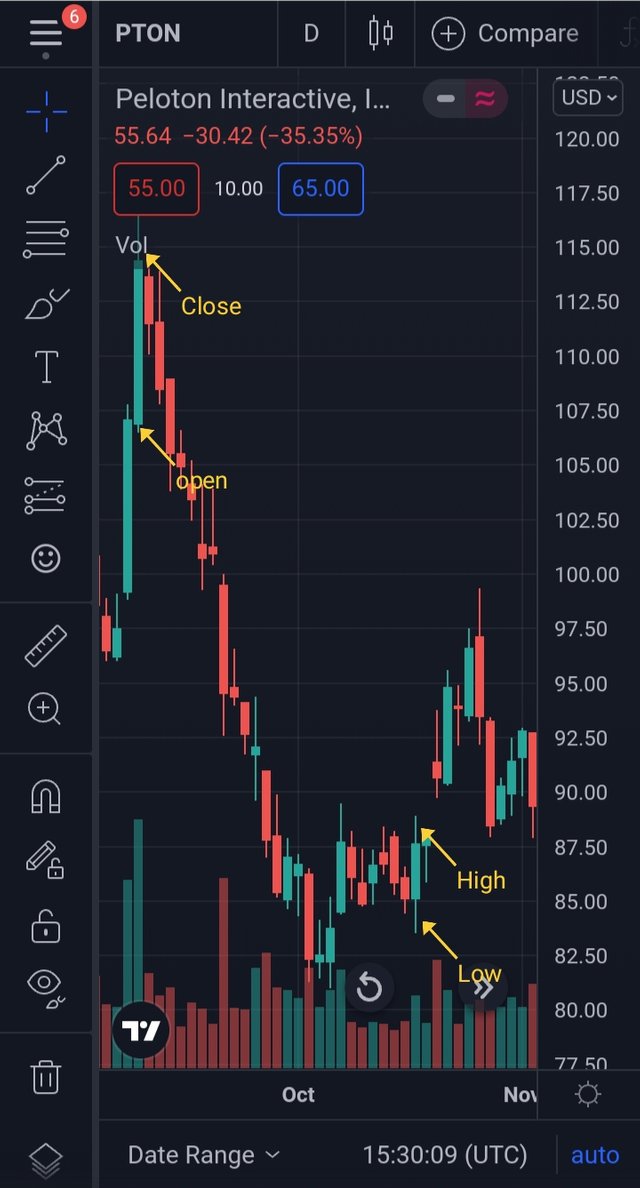
After a particular time the closing price of the asset is always higher than the open price in a bullish candlestick. The highest price is located at the top of the bar while the lowest price is located at the bottom of the candlestick.
High price
High price is the highest price that is attained by the asset in a given time interval. It was indicated on the top of the candlestick in the chart .
The highest price can be greater than or equal to the open or close price as it is the highest price achieved in the entire time interval.
Low Price
Low price indicates the lowest price that is recorded in a given time interval through a bullish price candlestick.
This was shows on the bottom of the candlestick. This low price can be equal to or less than the open or close price.
Open price
Open price is the starting price at which the Bullish candlestick started its activity. The open price of the Bullish candle also indicates that the price will move in an upward direction which is the Bullish direction.
Closing price
The closing price is the closing price for a specified interval at which the bullish candlestick activity ended. The closing price in a bullish candlestick is always higher than the open price.
BEARISH CANDLESTICKS:-
Bearish literally means to be rough or clumsy. In the stock market, bearish means that the stock is characterized by declining prices.
Bearish candlesticks indicate decreased price variations in the market. It shows the relative amount of the decreased price in the market by how much it decreased.
The bearish candle is shown in red. The appearance of a bearish candle indicates a decrease in the price of the asset.
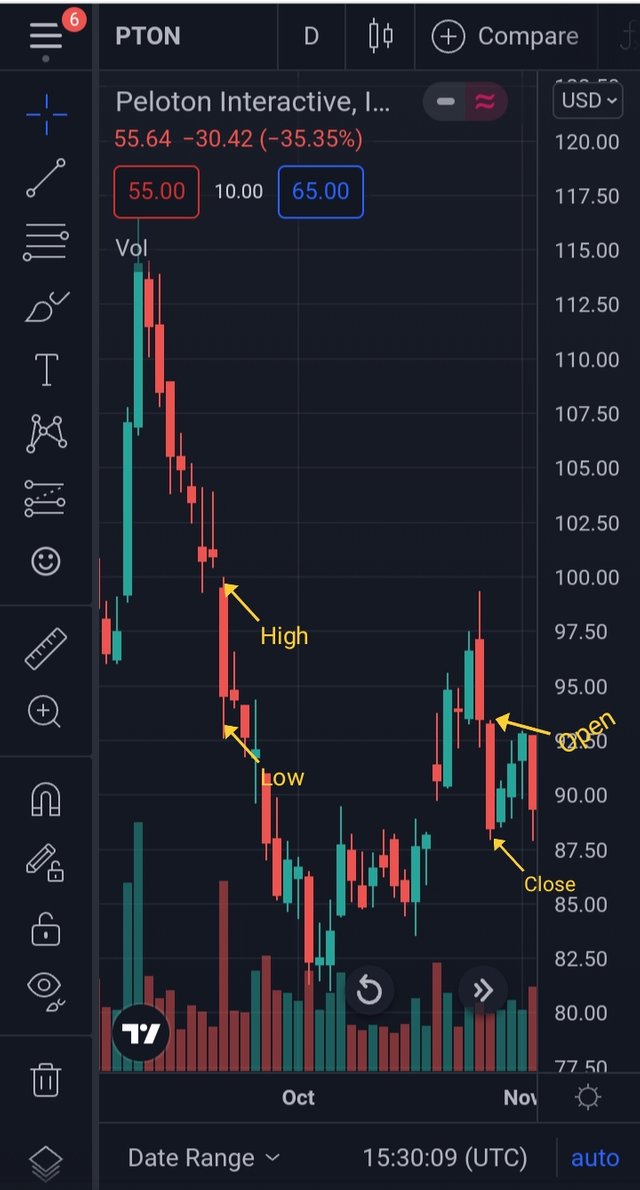
After a particular time the closing price of the asset is always lower than the open price in a bearish candlestick.
The highest price is located at the top of the bar while the lowest price is located at the bottom of the candlestick.
Open price
Open price is the starting price at which the bearish candlestick started its activity. The open price of a bearish candle also indicates that the price will move in a downward direction which is a bullish direction.
Closing price
The close price is the closing price of the price chart for a given period. The close price of an asset is higher than the open price of an asset in a bearish candlestick.
High price
High price is the highest price that is attained by the asset in that time interval. This is indicated at the top of the bearish candle. The highest price can be greater than or equal to the open or close price as it is the highest price achieved in the entire time interval.
Low Price
Low price indicates the lowest price that is recorded in a given time interval through a bearish price candlestick. It is indicated below the bearish candle. This low price can be equal to or less than the open or close price.
Conclusion:-
firsly i would thnx to my professor to give this amazing task and describe this very clearly in the above paragraph we learn many things in the bullish and bearish japanese candlestick and this is very important to the newcommers and a traders of steemit.
#club5050 😀