[ Crypto Trading with Moving Average ]-Steemit Crypto Academy | S6W2 | Homework Post for @shemul21


Introduction
The practice of trading is something that has been in constant development for decades. A lot of statistical concepts have been applied in real life trading scenarios to produce great results. One of these basic statistical concepts is the Moving Average. With a lot of real life uses, the moving average is something that cannot be ignored when facing the crypto markets. The clear lesson by professor @shemul21 has a lot of useful information on the concept. After goring through the lesson carefully, I will now try my best to complete the tasks given.
1. Explain Your Understanding of Moving Average.
In the most basic sense, an average is the central value of a set of given values. It is calculated by adding the values and diving the sum by the number of values in consideration.
A Moving average, however, is the mean that does not consider the entire data but just a subset of it depending on the number of periods. Then for every new data point, the average is moved forward and recalculated. This concept is also applied in the crypto and stock markets. The moving average calculates the average value of the price of an asset for a given number of periods (5, 8, 50, 100, etc). The number of periods considered in the calculation is the given subset of the entire historical price data and it gets recalculated for each new period. For example, given a 20-day moving average, we get the average price of the closing price for 20 days. At the 21st day, the first data point is dropped and the latest one is considered in order to maintain the period number. When these averages are joined, a line is produced and it functions as a technical indicator.
The Moving Average technical indicator is a simple yet versatile tool when it comes to crypto trading. This seemingly simple line can be used to identify the direction of a trend and spot good market entry. It also serves as dynamic support and resistance levels for the price of an asset aiding traders spot possible trend reversals. Below is an image Moving Average indicator on a crypto chart;
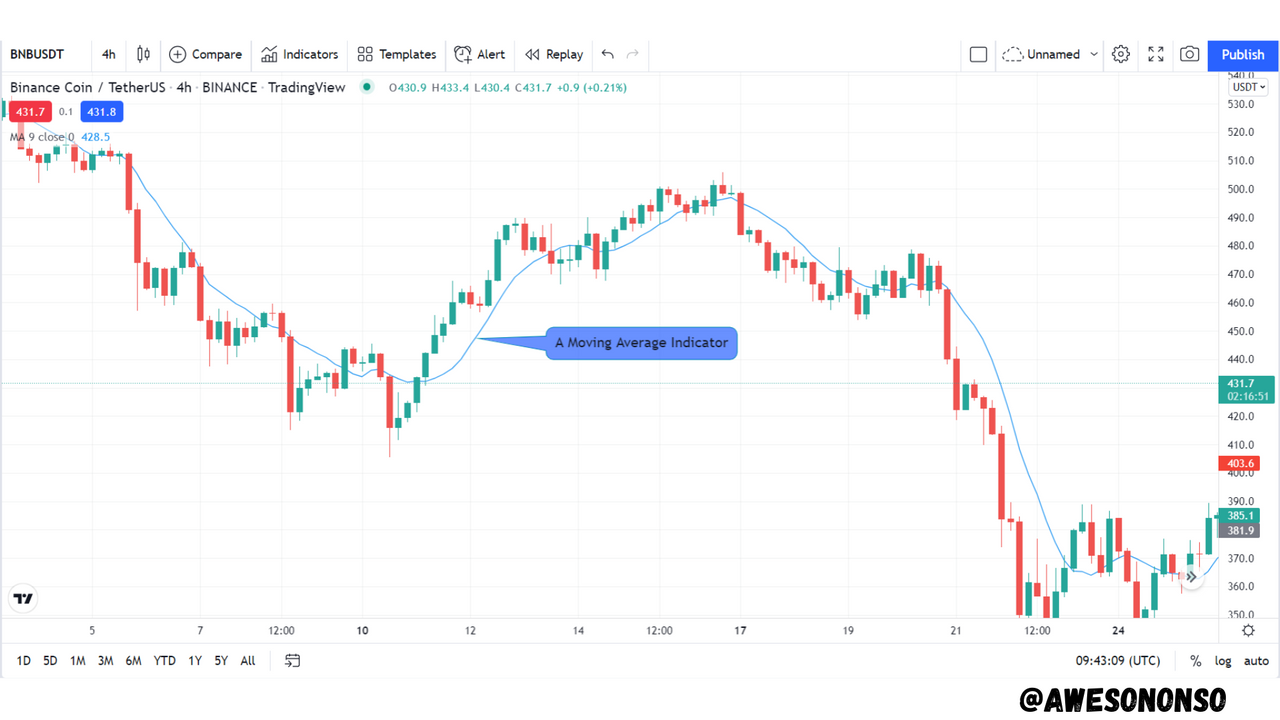
In a nutshell, the moving average tags along with the price of an asset providing a series of information to the trader using it. I will talk about this indicator better as I progress in the task.
2. What Are The Different Types of Moving Average? Differentiate Between Them.
The different types of moving averages include The Simple Moving Average, The Exponential Moving Average, and The Weighted Moving Average.
The Simple Moving Average
A Simple Moving Average (SMA) is technical indicator line that is drawn by simply calculating the arithmetic mean of the prices of the periods considered. The arithmetic mean is the most basic mean that most of us know about. The formula for the SMA is given as;
where;
P = the price or data points for each period up to the nth period.
N = the number of periods considered.
Below is an image of a Simple Moving Average with a period of 50;

The Exponential Moving Average
The Exponential Moving Average (EMA) is a type of moving average that gives more importance to the prices of the most recent periods. For this reason, the EMA reacts to price changes faster than the SMA. Due to the fact that the EMA considers the latest prices to be more important, we can say that they are assigned more weight than prices of older periods. Therefore, the EMA can also be referred to as an Exponential Weighted Moving Average.
To calculate the EMA we need to obtain the multiplier that would be used for the weighting. The formula for this is given as;
where N is the number of periods.
In most cases, "smoothing" above is mostly given the value of 2 so that just the most recent data points are weighted.
After the multiplier is calculated, we can fix the value in the calculation for the EMA which is given as;
where;
Pn = the price of the current period
k = the multiplier
EMAy = the EMA of the previous period.
Below is an image of an Exponential Moving Average with a period of 50;

The Weighted Moving Average
A weighted average is one that is obtained when the different data points are assigned different levels of importance known as weights. In Statistics, these weights are multiplied to their corresponding data points and summed up. Then the value is divided by the sum of all the weights.
As an indicator, the Weighted Moving Average (WMA), assigns weights to the different data points. Most recent data points are considered to be more important and therefore have more weights. The relevance or weights of the data points reduce with each previous period.
The formula for calculating the WMA is given as;
Below is an image of a Weighted Moving Average with a period of 50;

Differences between the different moving averages
| SMA | WMA | EMA |
|---|---|---|
| The SMA considers all data points to be equally relevant. | The WMA considers the most recent data to be more important with their importance reducing gradually with every new period. | The EMA gives more priority to the most recent data points as set by the multiplier. |
| The SMA lags much more than the EMA and WMA. | The WMA is more responsive to price than the SMA. | The EMA reacts faster to price changes than the WMA and SMA. |
| The SMA is more effective in long term trades because it reacts slower to price changes. | The WMA is better for shorter terms due to the fact that it reacts faster than the SMA. | The EMA is best for short term trades due to its high level of responsiveness to price changes. |
| Due to the fact that the SMA is best for long term trades, it would be more reliable with higher values. | The WMA is better with moderately high or low values as it can be used in shorter time frames. | The EMA is more reliable with small values because it is better in short time frames. |
3. Identify Entry and Exit Points Using Moving Average. (Demonstrate with Screenshots)
I have already stated that Moving Averages can be used to determine good entry and exit points in trades. To demonstrate this, I will be using a 20 period EMA and a 100 period SMA. In this illustration, the 20 EMA serves as the fast moving average while the 100 SMA serves as the slow moving average.
Buy Trades
To identify a good entry for a buy trade, we need to make sure that the 100 SMA is well below the price. This would indicate that the bulls are in control in the longer term and the 100 SMA is their dynamic support level. Now, with the price above the 100 SMA, it should fall back at the 20 EMA giving us an entry signal. Different buy positions can be opened when the price touches the 20 EMA with the stop loss at the 100 SMA level.

In the image above, we can see that at different points the price touched the 20 EMA and rose higher.
Sell Trades
For a Sell trade, the 100 SMA should be above the price acting as a dynamic resistance level. This would mean that the bears are in control in the long term. To identify an entry signal, the price should rise and touch the 20 EMA. The stop loss should be placed at the 100 SMA level since that is the resistance.
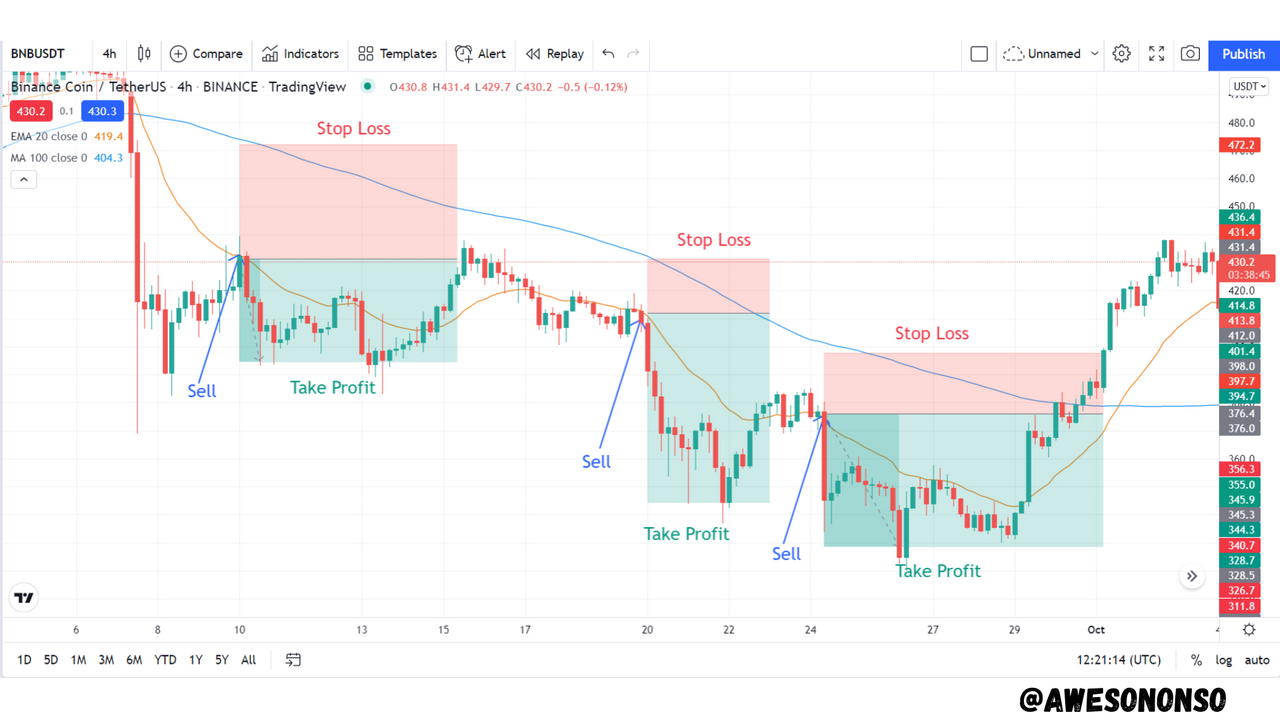
In the image above, we can see that at different points the price touched the 20 EMA and reversed downward.
4. What do you understand by Crossover? Explain in Your Own Words.
A crossover is simply a situation where two different Moving Averages cross each other to produce a market signal. Crossovers between Moving Averages can be very helpful especially when producing long term signals. For a typical crossover, there is always a fast moving average (with a smaller period) and a slow moving average (with a higher period). The fast moving average reacts faster to price changes and so makes the crosses with the slow moving average giving off bullish or bearish signals. To illustrate this, I will be using a 50 period EMA and a 200 period EMA.
Bullish Crossover
For a bullish crossover, the 50 EMA would cross above the 200 EMA during an uptrend. This type of cross is called a Golden Cross. I have illustrated this below;

In the image above, we can see that the 50 EMA crossed the 100 EMA upward. We can see that this is very significant as the bull ride lasted for months.
Bearish Crossover
For a bearish crossover, the 50 EMA would cross below the 200 EMA during a downtrend. This type of cross is called a Death Cross. I illustrated this below;

In the image above, we can see that the 50 EMA crossed the 100 EMA downward. Just like the Golden cross, this is very significant as the bear market lasted for months.
5. Explain The Limitations of Moving Average.
Moving averages are generally lagging indicators. This means that they follow trends and do not give the best entry point and so do not maximize profit.
It is difficult to know the period to use on a Moving Average. Smaller periods on the Moving Average indicator makes it generate many more signals of which some of them can be false. Larger periods would hardly generate signals for short term profits.
During very volatile markets, the Moving Average can generate a lot of signals and cause noise.
Due to the evolution of the markets, a lot of traders consider the Moving Average as an obsolete technical indicator.
Conclusion.
The relationship between the price of an asset and Moving Averages cannot be overemphasized. As a statistical tool, the Moving Average has proven to be very useful in the crypto markets. A lot of other indicators have been developed with the use of the concept and these indicators have also been very successful. As a single indicator however, it is important to be very cautious when applying any Moving Average on a crypto chart.