[Crypto Trading With Linear Regression Indicator]- Crypto Academy /S5W5-Homework Post for kouba01


Introduction
Different mathematical approaches are applied in different aspects of life. In technical analysis and financial trading, mathematics and statistics play a major role on price analysis and the functioning of different technical indicators. A special indicator in such a case is the Linear Regression Indicator which professor @kouba01 has really simplified. After carefully going through the lesson, I will now attempt the task given to the best of my abilities.
1. Discuss your understanding of the principle of linear regression and its use as a trading indicator and show how it is calculated?
Linear Regression is a statistical concept that uses regression analysis to determine the value of a dependent variable from an independent variable. Variables considered using linear regression are said to have a Linear relationship. This relationship becomes visible by creating a Scatter plot on a graph of the dependent variable against the independent variable and drawing a Line of Best fit through the points. Let us look at the illustrations below:

From the image above, we can see that the line drawn in both graphs are straight. For this type of regression analysis, the slope (negative or positive) does not affect the linearity of the analysis given that the line between the points is in fact a linear line.
The line of best fit is drawn using the Least squares method to ensure that the sum of the squares of the distances of the line to the plots are minimized. In order words, it is drawn in a means to reduce deviation as much as possible.
Use of linear regression as a trading indicator
Linear regression can be applied in different areas of study and trading is one of them. The Linear Regression indicator is not just a trend following indicator rather it tries to forecast the price of an asset in the next period. Although it looks like a Moving average, it is quite different because it does not consider the average of the data points and so does not delay as much as a Moving Average.
The linear regression line is plotted with price (Y-axis) against the number of periods (X-axis). The price considered in this case is the closing price of each period and the number of periods by default is 14. When these are plotted on the graph, we draw the line of best fit. The ending value of the line would be equal to the value of the linear regression indicator for the current period. In essence, the indicator is achieved by plotting the end points of different lines of best fit.

How the indicator is calculated
As stated above, the value of indicator at a particular period is the end value of the line of best fit plotted. So to calculate the indicator, we need to draw the line of best fit. The line can be calculated using the simple straight line formula;
where;
y = current price
x = current period
m = the gradient or slope
c = the constant or y-intercept (value of y when x = 0)
To calculate m and c;
where n is the number of periods.
When we get the equation of the line and draw the line of best fit, the last value would be the same as the value of the linear regression indicator for the current period. Below I gave a rough illustration:

2. Show how to add the indicator to the graph, How to configure the linear regression indicator and is it advisable to change its default settings? (Screenshot required)
To add the indicator to the chart, follow the steps below:
Step 1: On TradingView, select a chart and click on fx indicators.

Step 2: Search "Linear" the scroll down and select the Regression Line Formula

The indicator comes up

To Configure the indicator, follow the steps below:
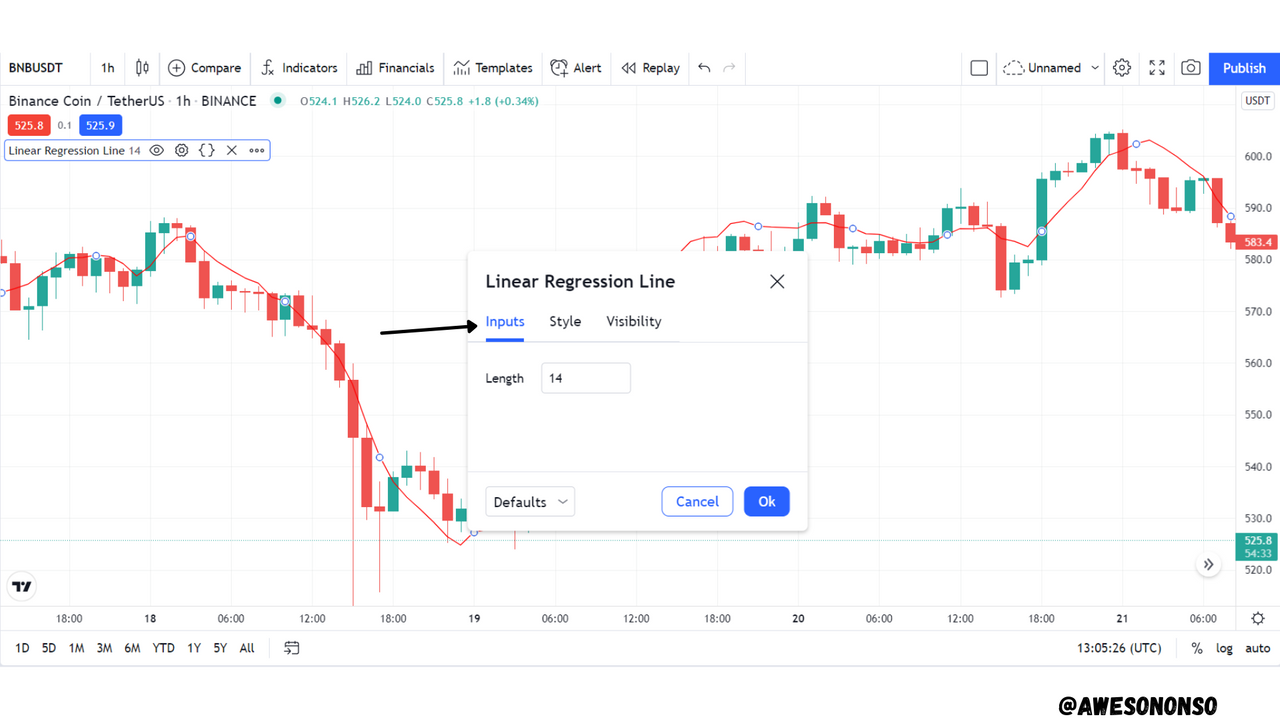
Click on the settings icon as illustrated below;

- The Inputs tab contains the length setting which can be used to set the number of periods considered on the indicator. The default is 14.
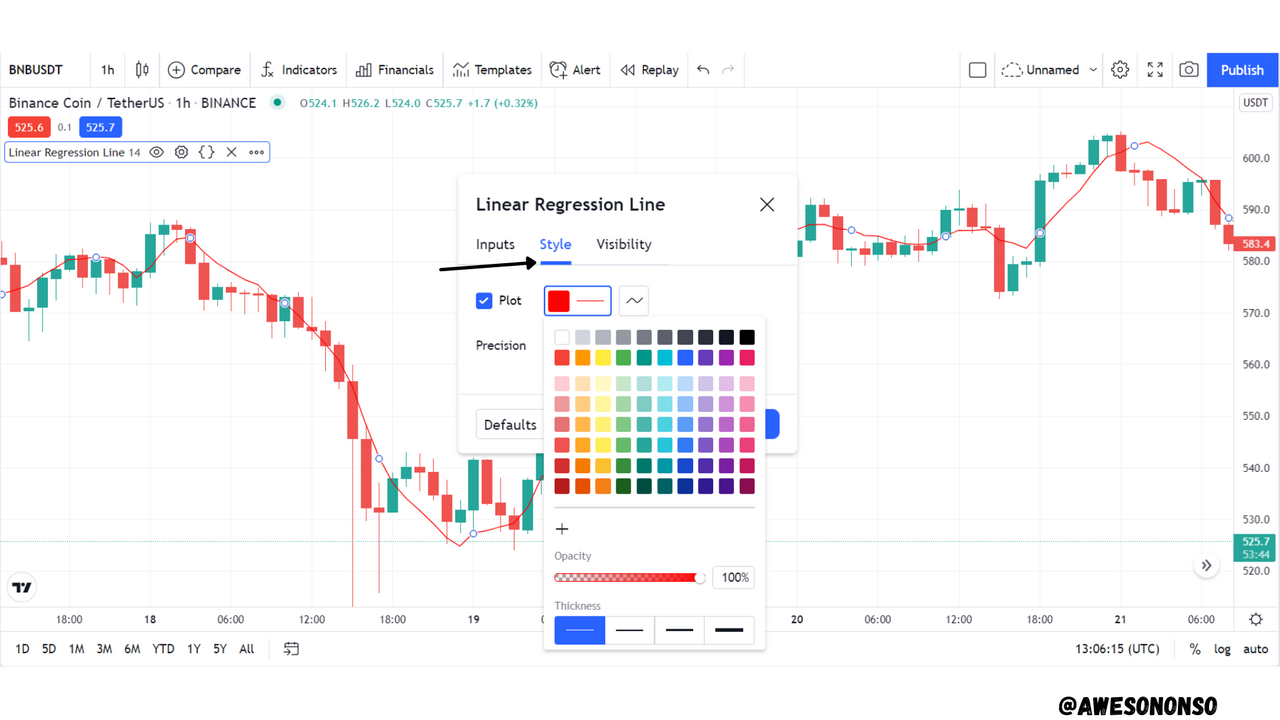
- The Style tab can be used to configure the color, opacity and thickness of the indicator.
Is it advisable to change the default settings?
By default, the Linear Regression indicator is set to a length of 14. This is the length that is used by most traders. Changing the length would change the sensitivity of the indicator. A smaller length would make the indicator more sensitive to price changes while a bigger length would make it less sensitive to price changes. The length would also affect how frequent crosses with the price action would occur.
The images below show the Linear Regression indicator on the same chart but set with different length:

In the image above, the indicator is set to the default length of 14. There is a balanced number of crosses. Also the indicator is neither too peaked nor too flat.

In the image above, the indicator is set to a length of 7. This smaller length causes the indicator to have more peaks. It also causes the indicator to make more crosses with the price action.

In the image above, the indicator is set to a length of 21. This smaller length flattens out the indicator and causes it to have less peaks. Also, the indicator makes less crosses with the price action with some crosses coming in very late.
Considering this, the setting of the indicator would depend on the wavelength of the candlestick chart. This is similar to how a Moving Average is set. A smaller wavelength would require a smaller length on the indicator while a bigger wave length would a bigger length on the indicator.
The image below, shows a chart with a huge wavelength. To be able to get some signals using the Linear Regression indicator, I set the length to 63.

3. How does this indicator allow us to highlight the direction of a trend and identify any signs of a change in the trend itself? (Screenshot required)
Trend Indication
The Linear Regression indicator, as stated, works in a similar way as a Moving Average. So, depending on the period employed, the indicator would help identify a trend by its direction of movement. During an uptrend, the indicator would make an upward movement or we can say it would have a positive slope. During a downtrend, the indicator would make a downward movement or we can say it would have a negative slope.
Let's look at some images:
Bullish Trend

From the image above, we can see that the Linear Regression Indicator had an upward movement as the price physically made higher highs and higher lows. This is a very clear indication of an uptrend movement because the indicator has a positive slope.
Bearish Trend

From the image above, we can see that the Linear Regression Indicator had a downward movement as the price formed lower lows and lower highs. This is a clear indication of a downtrend movement because the indicator has a negative slope.
Trend reversal
A change in the slope or direction of the Linear Regression Indicator would indicate that there would be a possible trend reversal in that direction. If the line makes a cross with the price action it would mean that the signal is quite strong. Let's look at the two possible scenarios:
Bullish reversal
A bullish reversal occurs when the Linear Regression indicator initially moves downward in a downtrend but makes an upward curve and starts to move upward. A stronger signal for this is given when the indicator crosses the price and starts to move below it like a dynamic support. An example is given in the image below;

From the image above, at the marked points, the indicator had crossed the price and started an upward movement. This was followed by a bullish reversal.
Bearish reversal
A bearish reversal is the opposite of a bullish one. In this case, the Linear Regression indicator initially moves upward in an uptrend but makes a downward curve and started to move downward. A stronger signal for this is given when the indicator crosses the price and starts to move above it like a dynamic resistance. An example is given in the image below;

From the image above, at the marked points, the indicator had crossed the price and started a downward movement. This was followed by a bearish reversal.
4. Based on the use of price crossing strategy with the indicator, how can one predict whether the trend will be bullish or bearish (screenshot required)
When the price crosses the Linear Regression Indicator, it is known as a cut. Cuts can generate buy or sell signals depending on the direction.
Bullish cross
For a bullish cross to occur, the Linear Regression Indicator would have to be above the price and then the price would have to cross the indicator upward. For this type of cross to be confirmed, the closing price of the candle would be higher than the previous candle. A bullish cross gives a buy signal as the trend is expected to be bullish.

Bearish cross
A bearish cross occurs when the Linear Regression indicator is below the price and then the price crosses the indicator downward. The closing price of that candle would be lower than the previous candle and this would mean a sell signal.

5. Explain how the moving average indicator helps strengthen the signals determined by the linear regression indicator. (screenshot required)
A Moving Average takes the average of the periods to give its signals. Because of this, the indicator is known as a lagging indicator as it gives signals relatively late compared to the Linear Regression indicator. This is a good thing though because an MA can be used to confirm signals given by the Linear Regression Indicator. I illustrated this in the images below with a Linear Regression Indicator period of 30 and a Moving Average period of 30 as well.

In the image above, the price had crossed the Linear Regression Indicator upward to signify a possible buy signal. The Moving average was able to confirm the signal after the price had crossed it in the same direction. A trader can open a long position at this point. After this, we can see that there was an uptrend.

In the image above, the price had crossed the Linear Regression Indicator downward to signify a possible sell signal. The Moving average was able to confirm the signal after the price had crossed it in the same direction. A trader can open a short position at this point. After this, we can see that there was an downtrend.
6. Do you see the effectiveness of using the linear regression indicator in the style of CFD trading? Show the main differences between this indicator and the TSF indicator (screenshot required)
The Linear Regression Indicator is really useful in CFD trading in that it helps to forecast future prices. The Times Series Forecast (TSF) functions just like the Linear Regression Indicator in a practical sense. The TSF, just like the LRI, joins the end value of different Linear Regression lines to give signals but mostly in the short-term.
Initially, when we add the TSF to the chart, it does not come like the LRI as shown below:

To fix this, we have to change the following settings;
- Tick Short Term Extrapolation box.
- Change the Source to Close to consider the closing price.
- Change the length as desired.

And then, the TSF becomes similar to the LRI as seen below:


Differences between the TSF and the LRI
The TSF adds the slope of each regression line to the end value while the LRI does not.
By default, the TSF works with the open price while the LRI works with closing prices.
7. List the advantages and disadvantages of the linear regression indicator
Advantages
The Linear Regression indicator gives quicker signals and works quite well for price forecast.
It acts as dynamic support and resistance levels for the price action.
Disadvantages
It is very sensitive to price changes especially with smaller periods.
The signals given are early but some of them can be false.
Because it is very sensitive to price changes, it is not suitable for very volatile conditions.
It should not be used alone.
Conclusion
Linear Regression is an important concept that has proven to be extremely useful in crypto and financial trading. As we have studied in the lesson, the Linear Regression Indicator applies a popular statistical concept to trading.
The Linear Regression indicator can be used to identify a trend and generate signals for a position. Although the indicator is easy to use, caution should always be taken when we employ its use.