Crypto Academy Week 16 - Homework Post for @kouba01


INTRODUCTION
Learning about technical indicators for the past few weeks has been really enlightening. After learning about the RSI and MACD indicators, I have been able to improve my trading strategy and the results have been quite impressive. However, it isn’t enough to just walk away with a little knowledge.
This week, professor @kouba01 has done an awesome jobs trying to make us understand the basics of the Bollinger Bands indicator. I will demonstrate my understanding of the lectures by completing the assignments given.
Define the Bollinger Bands indicator by explaining its calculation method
The Bollinger bands are a very popular technical analysis tool developed by American Author and financial analyst John Bollinger in the early ‘80s. Bollinger wanted to make an indicator with dynamic bands unlike the usual fixed width bands. In order to fulfill this, he incorporated volatility in his trading strategy a lot and was able to use standard deviation to develop bands that were adaptive to trend movements.
The Bollinger bands have been in use for a couple of decades now. The tool has proven really useful in price trend, volatility level determination and giving clear dynamic support and resistance levels.
Unlike the MACD which uses EMAs, the Bollinger bands tool uses a Simple Moving Average (SMA) for its analysis. The SMA, which is known as the center baseline, is bordered upward and downward by two bands equal but opposite distances to it. These altogether make up the Bollinger bands indicator.
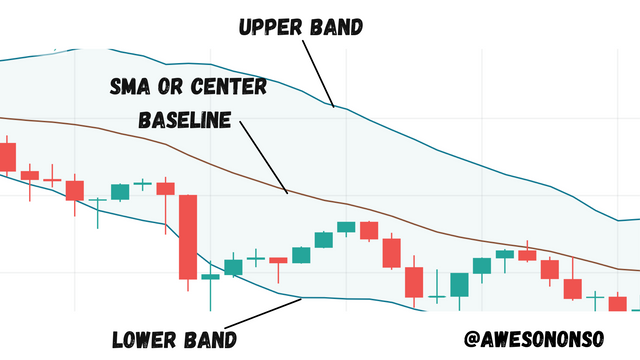
The Bollinger bands on a candlestick chart
How it is calculated
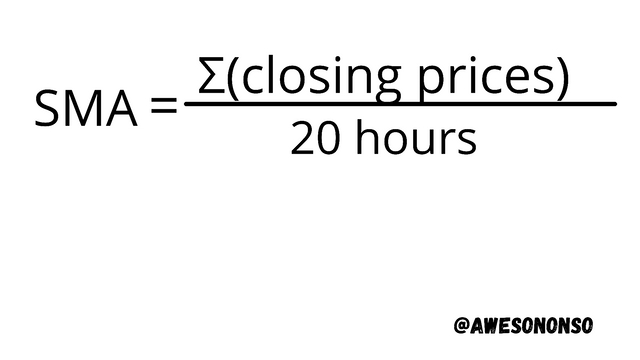
To calculate the Bollinger bands, first we start with the Simple moving Averages. The source of a simple moving average is usually the closing price of the asset each period. So to calculate, as the name implies we simply take the average or mean of the the closing prices to be considered.
Let us work with an hourly period. By default, the SMA is set to a period value of 20. Therefore, we have to take the average of the closing prices for 20 hours.
Next we need to calculate the bands. The bands are calculated by taking the standard deviation of the SMA then adding and subtracting equal number of times to achieve the upper and lower bands respectively.
We are using an hourly period on a 20 period SMA. By default, the 20 period SMA uses 2 standard deviations. This means we add and subtract 2 standard deviations to get the upper and lower bands respectively.
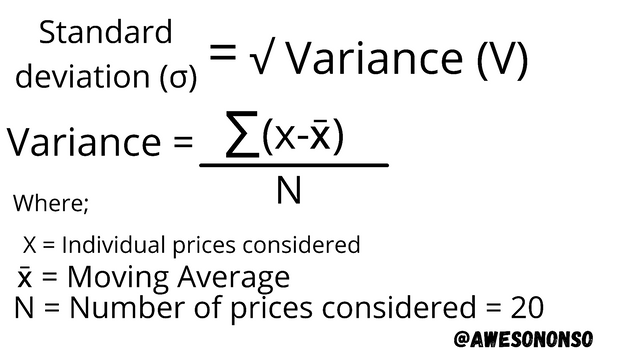
Calculating the standard deviation, we use the popular formula as shown below:
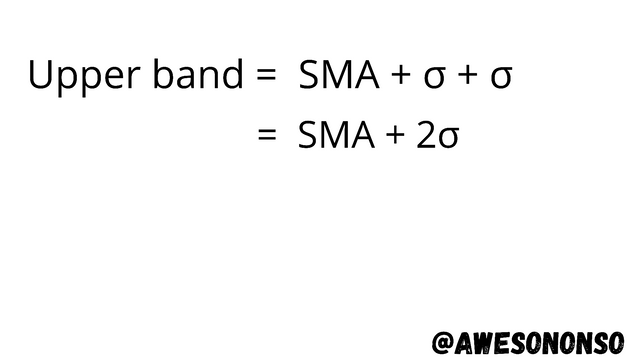
For the upper band add the standard deviation (σ) twice to the SMA as shown below:
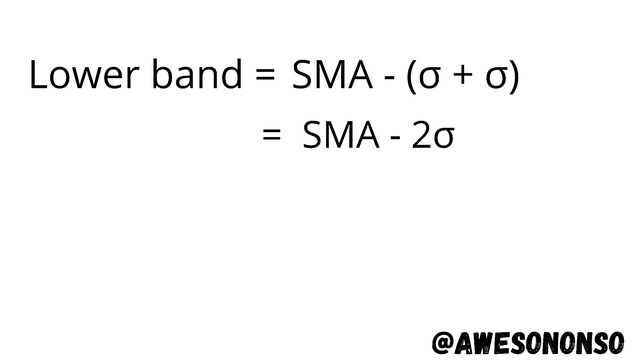
For the lower band, subtract the standard deviation (σ) twice to the SMA as shown below.
How the Bollinger bands work
The Bollinger bands have proved to be very versatile in the financial and crypto markets over the years. Below are some of the ways the Bollinger bands work in trading:
1. Measuring Market Volatility: Cryptocurrencies are regarded as extremely volatile financial instruments so volatile that major losses can happen in minutes. Bollinger understood this when creating the Bollinger bands hence his incorporation of standard deviation.
Standard deviation is a measure of dispersion that determines distance of individual data from a measure of central tendency which in this case is the SMA. The Bollinger bands are able to detect changes in price away from the average over a given period thanks to this feature.
Typically, during a sideways market, the volatility of an asset is low and the price moves relatively stable. The Bollinger bands help determine this by a phenomenon called Bollinger Band Squeeze where the bands shrink and are closer to the baseline.
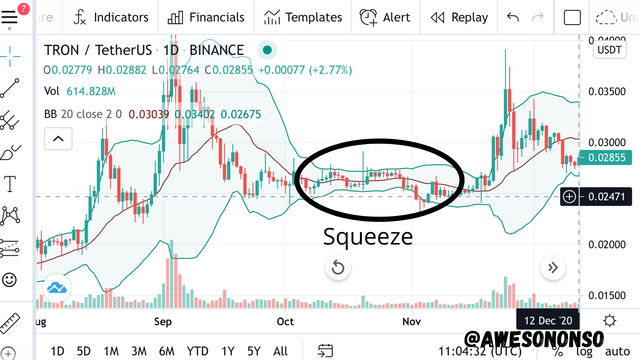
Market with low volatility
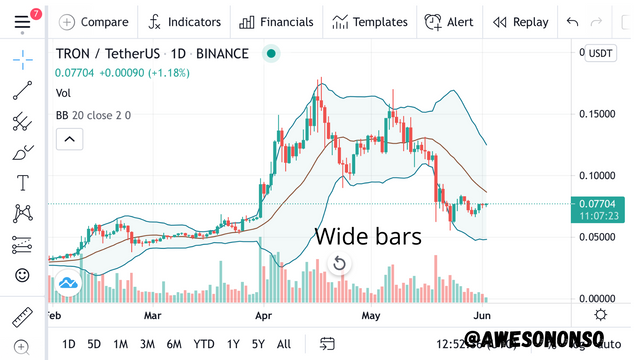
Also, widening of the bands indicates a highly volatile market . This happens in sharp market movements.
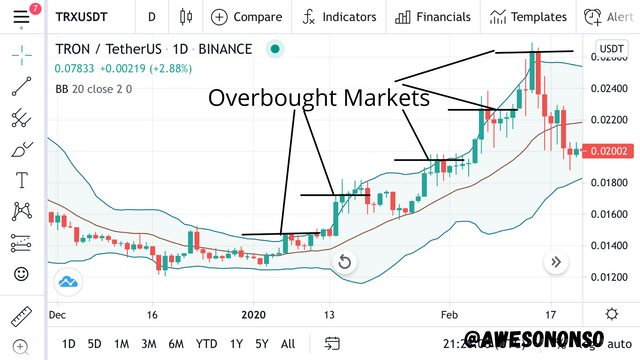
2. Overbought signals:
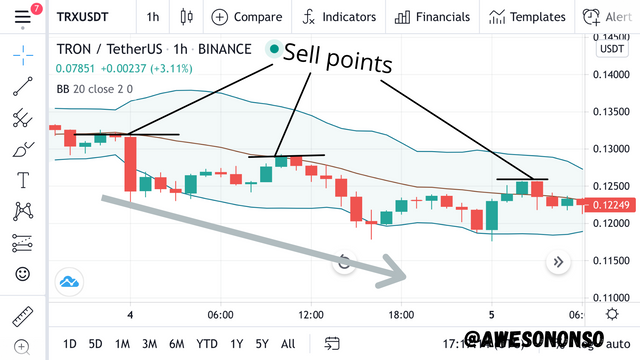
An overbought asset is one that trades significantly high. The Bollinger bands are also reliable when determining an overbought market. Generally, when the price tags the upper hand, the market is considered overbought. After the tag, the price “bounces back”. Traders can see this as a good sell opportunity.
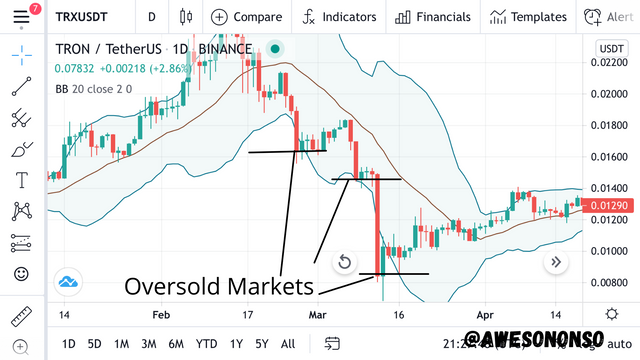
3. Oversold signals:
An oversold asset is one that trades significantly low. On the Bollinger bands tool, a market is said to be oversold when the price tags the lower band. After it tags the lower band, it bounces back upward. This serves as a good buy signal.
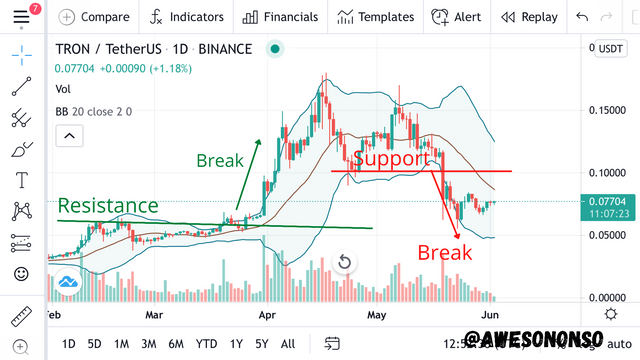
4. Dynamic Support and Resistance:
The Bollinger bands can be used with established support and resistance levels. The upper band would normally coincide with the resistance levels while the lower band would normally coincide with the support levels.
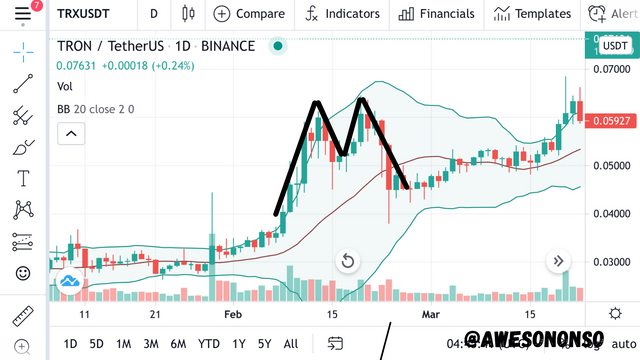
5. Used with M-top patterns:
M-top patterns are somewhat similar to double tops but with unequal tops. Using Bollinger bands with M-tops, firstly there is a high formed that touches or goes above the higher band. The high is followed by a pullback towards the center baseline. Next there is another high that typically goes above the first high but is not enveloped by the upper band. This signals a bearish reversal that is confirmed by a support break.
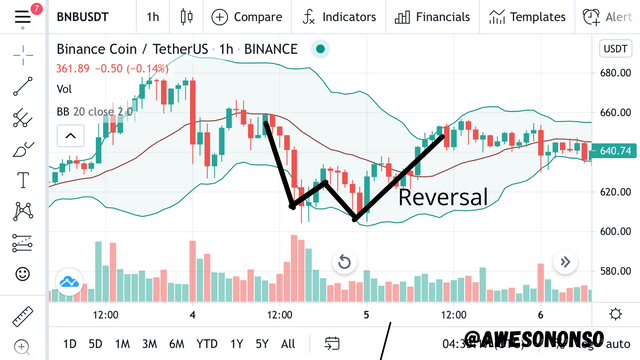
6. Used with W-bottom patterns:
W-bottom patterns are the opposite of M-tips. To start, a low is formed from a steady market and it tags or goes below the lower band before returning to the center baseline. Then a second lower low is formed but it is not enveloped by the lower band. This is a good signal for a possible bullish reversal that is confirmed by a break of resistance.
Best Bollinger band setup
To start, I’ll illustrate how to setup the Bollinger bands:
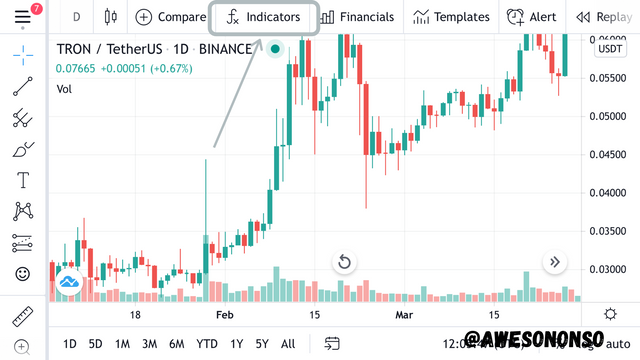
Step 1: After loading a chart on TradingView, click on “fx indicators”.
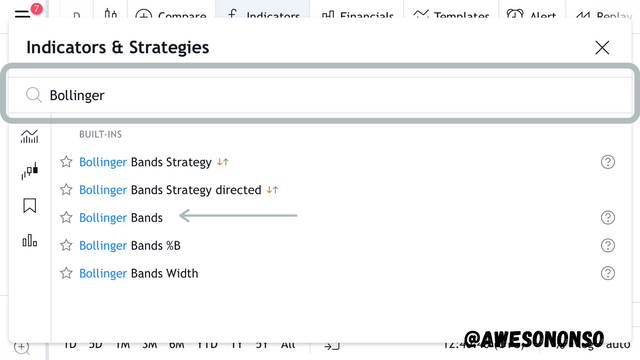
Step 2: Search “Bollinger bands” and select the indicator.
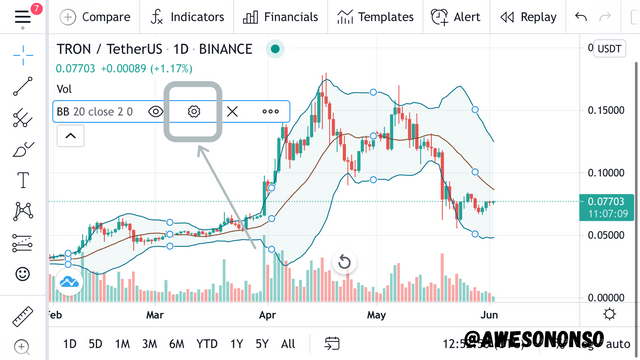
Step 3: The indicator comes up. To view setup, click the corresponding settings button
The parameters
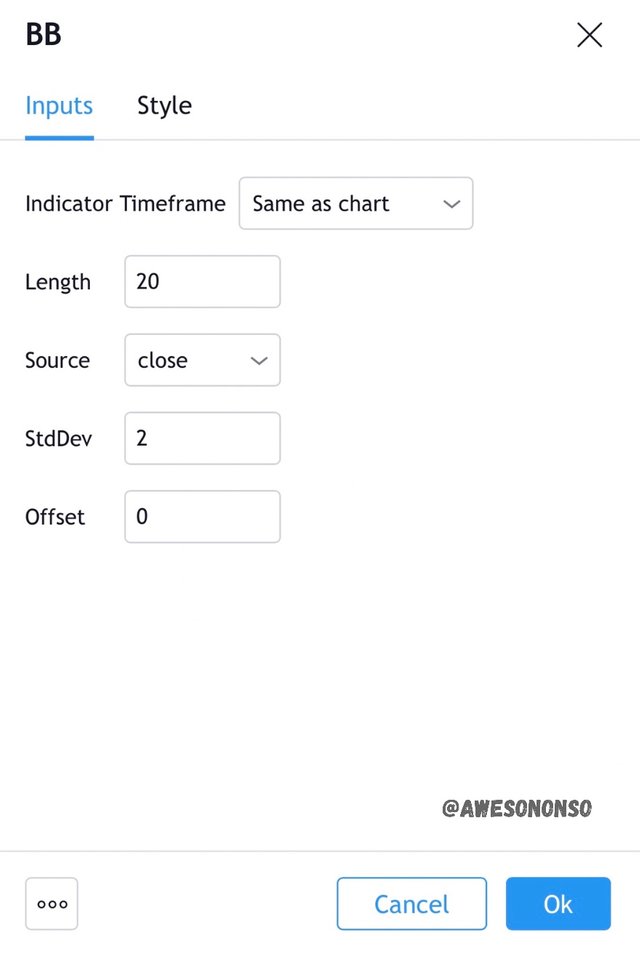
Indicator Timeframe is how much time is considered on the indicator relating to the chart. This setting is best this way.
Length is the period of the SMA. By default, the setting is 20 meaning it considers the prices of 20 periods (days, weeks, minutes,etc).
Source is what price the indicator is based. By default the source is the closing price.
StdDev is the number of standard deviations that are added to and subtracted from the SMA to produce the bands. With a 20 period SMA, the preferred number of standard deviations is 2. The 2 standard deviations normally covers 95% of price moves. Some traders use the 1 standard deviation but this only covers about 68% of the price moves. Basically the more standard deviations that are involved, the more price moves that are covered but 2 standard deviations is suitable for 20 periods because it gives more signals than 3 standard deviations. Basically, less is more. See illustration below:
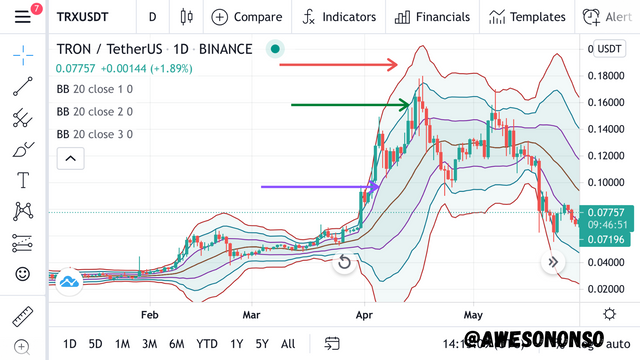
From the picture above, we can see that the 1 deviation bands(purple) barely show any signals.The 3 deviation bands(red) show a few bounce backs but not enough for any trade. The 2 deviation bands (green) give more signals in the form of bounce backs on resistance levels.
The number of standard deviation really depends on the Moving average period. A 10 period SMA typically needs 1.5 deviations while a 50 period SMA typically needs 2.5 deviations.
What is breakout and how to determine it
A breakout in crypto occurs when the price of the asset breaks a support or resistance level. In such situations, the volatility of the market increases significantly.
As mentioned before, the Bollinger bands work really well in detecting volatility. Tight bands indicate low volatility in the market. During breakouts, the price comes fully out of the bands either upward or downward. This is followed by an expansion is the bands. The expansion is due to the sudden increase in volatility of the asset’s price.
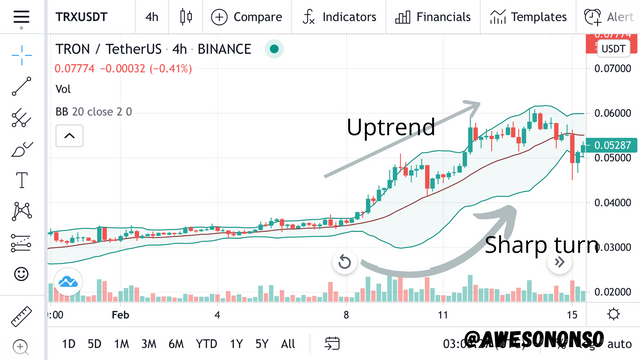
During a bullish breakout, the lower band makes a sharp downturn while the price moves above the center baseline.
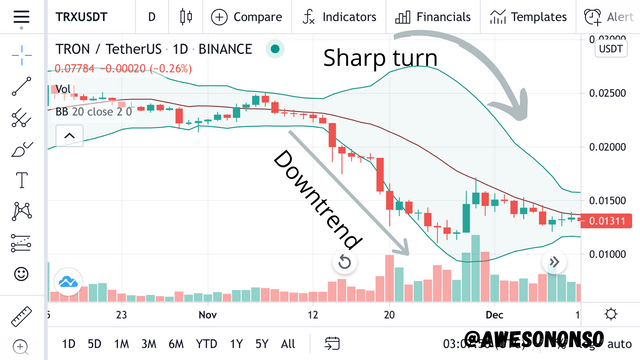
During a bearish breakout, the higher band makes a sharp high turn while the price moves below the center baseline.
How to use Bollinger bands with a trending market
Trending markets occur when prices generally move in a single direction either upward or downward.
Finding a trend with the Bollinger bands is really simple because the bands follow the market trend. In an uptrend, the bands move upwards while in a downtrend the move downward.
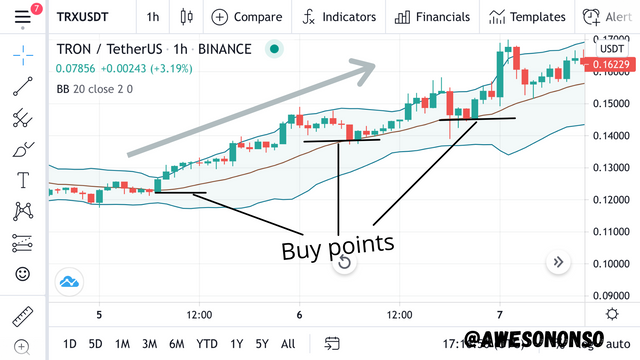
During trending markets, traders mainly make use of the center SMA baseline for trading. For and uptrend, the SMA serves as a support. Traders find great buy signals when the price touches the SMA.
Similarly, during a downtrend, the SMA serves as a resistance with great sell signals created when the price touches the SMA.
The best indicator to use with Bollinger Bands
The Bollinger bands are great when it comes to trading. Still, no tool comes without flaws. It is always advisable to combine analysis tools for optimum results.
I would say that the RSI is a great tool to combine with the Bollinger bands. The RSI is a momentum oscillator that helps to confirm a trend’s relative strength.
For overbought and oversold signals
If a market tags the upper band of the Bollinger bands but not above 70 on the RSI, we should assume that the market would still increase in price. When it gets to 70, we can then say that the market is overbought an so we sell the asset.
The same goes with oversold signals. An oversold signal on the Bollinger bands might just be a downtrend on the RSI. When the RSI goes below 30, we can then confirm the signal and enter a buy position.
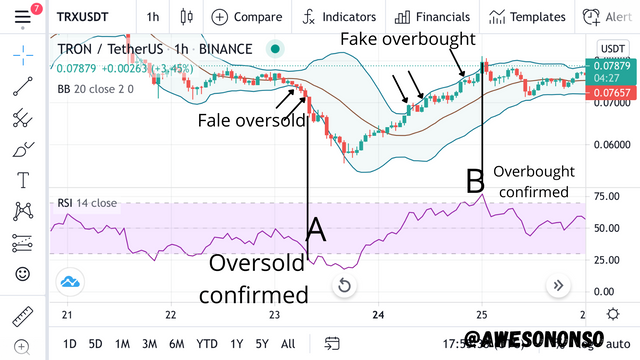
From the image above, the small arrows show areas of fake oversold and overbought signals. The oversold signal is confirmed at the points A while the overbought signal is confirmed at the point B.
Divergence and reversals
The RSI can be used to confirm reversals from M-tops and W-bottoms formed on the Bollinger bands. When a valid M-top is formed on the Bollinger bands, the RSI gives a bearish divergence signal. Traders can immediately enter a sell position from here.
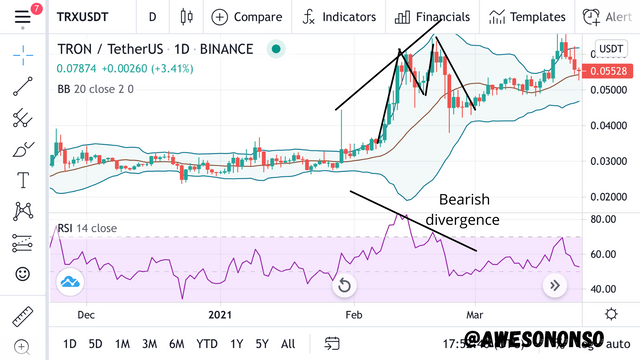
A bearish divergence signal conforming with a Bollinger bearish reversal
Similarly, when a valid W-bottom is formed on the Bollinger bands, the RSI gives a bullish reversal signal. From here, traders can enter buy positions.
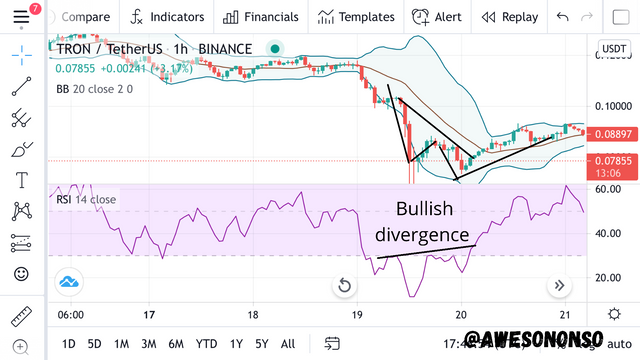
The bullish divergence on the RSI confirms the trend reversal
What timeframe does the Bollinger Bands work best on?And why?
The Bollinger bands work good on any timeframe. Its effectiveness is based on a trader’s strategy. A day trader or scalp trader should use the tool in shorter time frames while a swing trader should use it in more longer time frames.
For swing traders, the tool can even be used in a combination of timeframes for optimum results. Swing traders can use the tool to determine a general price trend of an asset in a long timeframe.
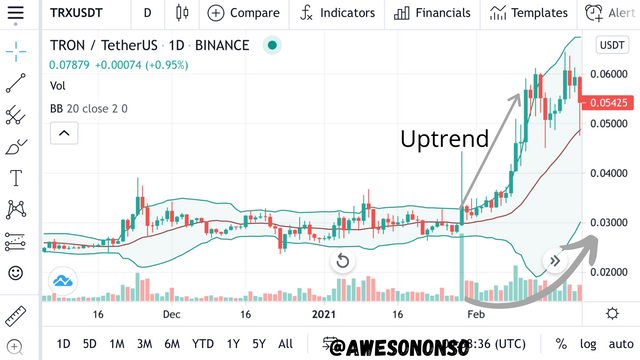
Uptrend in a daily chart
Then in a short timeframe, they can use it to determine best entry and exit points.
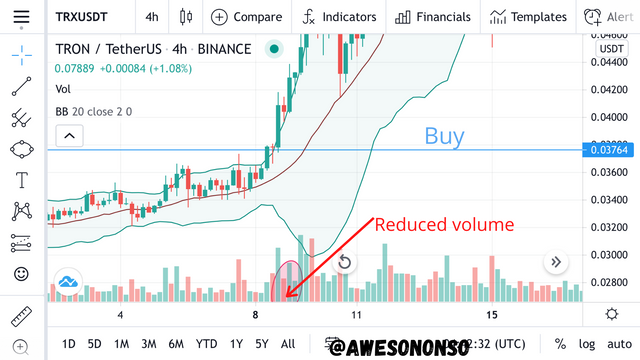
Confirming an entry point in a shorter time frame
Presenting various Bollinger Bands’ signal on a chart
For this task I would be showing different Bollinger bands’ signals on the TRX/USDT chart on an hourly chart.
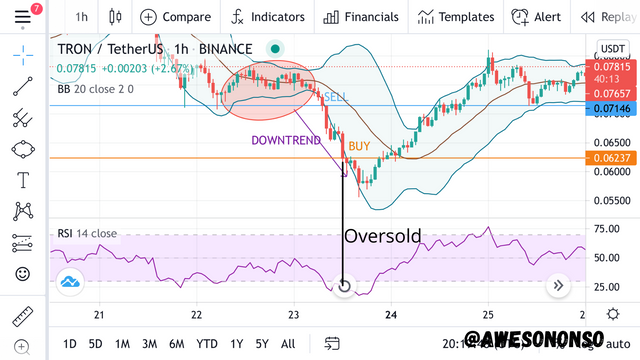
From the picture above, the close bands led to a breakout. The upper band opened up indicating a bearish breakout. I place a sell order right at 0.07146 USDT until the price got to 0.06237 USDT. I feel like its a perfect place to place a buy position because the RSI confirms an oversold market.
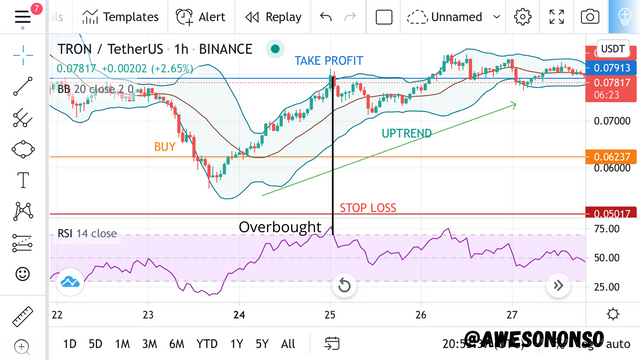
From the image above, I placed a buy position with a stop loss at 0.05017 USDT. The market went in the opposite direction but started to go in my direction shortly after. I took profit at 0.07913 USDT where a tweezer top was formed. This market is overbought at that position because crosses the upper band and the signal is confirmed by the RSI.
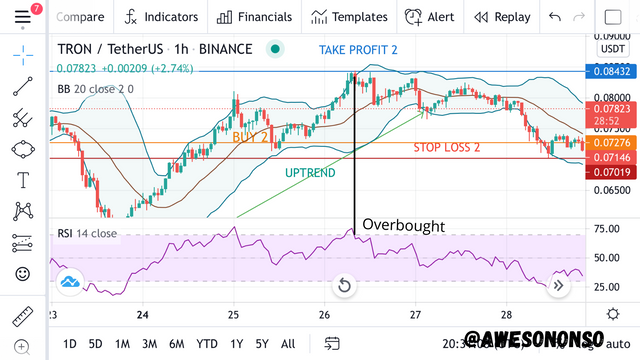
The market is still in an uptrend so there might be good entry positions to buy. The price broke the SMA that served as support and went all the way down to 0.07276 USDT. This is a good buy position. I placed a stop loss at 0.07019 USDT. The take profit is at 0.08432 USDT where another tweezer too was formed. The price there is also overbought because it crosses the upper line and is confirmed by the RSI tool.
CONCLUSION
The Bollinger bands are widely used by traders everywhere. Thanks to its ability to capture volatility, it is deemed a very reliable tool.
The tool can be used in trending and sideways markets. It is also great for confirming reversals along with the RSI.
Though a lot of traders trust the Bollinger bands, it is still advisable to always go into the crypto markets with caution. Just like every other tool, these bands have their flaws.
Special thanks to @kouba01
Hello @awesononso,
Thank you for participating in the 8th Week Crypto Course in its second season and for your efforts to complete the suggested tasks, you deserve a 10/10 rating, according to the following scale:
My review :
You really provided complete work that covered all the required points with valuable additions especially for the signals extracted through the BB indicator. You also analyzed well your choice in merging it with other indicators and your choice of timeframe. To conclude it with a summary based on a good example, following which you tracked the price movement of the TRX/USDT pair.
Thanks again for your effort, and we look forward to reading your next work.
Sincerely,@kouba01
Yess!
I put in my best even as a full time vet student.
Thank you so much professor. It’s really an honor!
Congratulations! Your post has been selected as a daily Steemit truffle! It is listed on rank 20 of all contributions awarded today. You can find the TOP DAILY TRUFFLE PICKS HERE.
I upvoted your contribution because to my mind your post is at least 8 SBD worth and should receive 18 votes. It's now up to the lovely Steemit community to make this come true.
I am
TrufflePig, an Artificial Intelligence Bot that helps minnows and content curators using Machine Learning. If you are curious how I select content, you can find an explanation here!Have a nice day and sincerely yours,

TrufflePig