Crypto Academy Week 14 - Homework Post for @fendit

INTRODUCTION
These days, there are a number of useful tools traders use in the careers. Technical analysis is a skill many traders have or want to learn for maximizing profits in the financial and crypto markets. But what happens when technicality meets sentiments? Well, that’s exactly what happens in the Elliott Wave Theory. Let’s talk about this a little more...
A recap of the Elliott Wave Theory
In the 1930s, Ralph Nelson Elliot became ill and went into retirement from his accountant career. With little to nothing to do, he began to study 75 years of market charts in different time frames. Elliott noticed that the commonly believed “random” movement of financial markets prices was not entirely random. He found out that the financial markets showed repetitive fractal patterns which he termed waves. Going deeper into his research, he discovered the these patterns were formed by collective investor psychology or crowd psychology. This became the basis of the Elliott Wave Theory.
In a nutshell, The Elliott Wave Theory(EWT) explains that changes in mass investor psychology influence financial market prices which show up as repetitive patterns (waves) on any time frame.
Application of the Elliott Wave Theory
The Elliot Wave Theory is one that is used in various ways for technical analysis. It can be applied in the following ways:
Identification of trend and trend reversals
The EWT majorly considers two wave types which are Impulsive and Corrective waves**. The impulsive waves defines the trend as either bullish or bearish depending on the overall market direction.
To identify reversals, the corrective wave would be longer than the impulsive wave. In this case, the corrective wave would become the impulsive wave for a new trend.
Profit maximizing
EWT helps traders maximize profits by showing good entry points and exit points. This process of hopping on trends for profits is called Riding a Wave. Traders would normally enter trade at the end of a corrective wave to take advantage of the next impulsive trade.
Identifying overpriced assets
Identifying the Elliott waves can really help traders know when a market is overpriced. This tackles the FOMO effect as many traders would not want to risk in an overpriced market.
Finding a Stop loss
Stop losses are safe havens for traders everywhere. The EWT helps traders locate best stop loss points while trading with the help of ratios. Bringing us to the next point...
Combination with Fibonacci ratios
The previously mentioned points can be enhanced with the use of Fibonacci ratios. Elliott incorporated Fibonacci ratios a lot during his research so they are quite fundamental.
We can use the Fibonacci lines to know when a correction is ending of when a trend is reversing. Implementing Fibonacci ratios help traders maximize profits by the key percentages. Each wave relates with the previous waves by the Fibonacci percentages. Some relationships are in the illustration below:
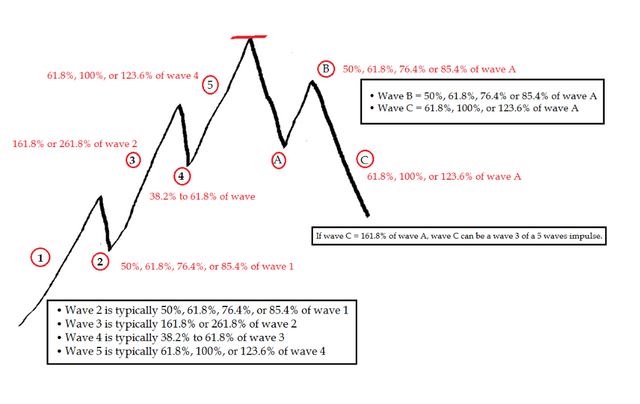
" Source
Combination with the RSI and MACD indicators
Speaking of combinations, the EW oscillator, which is a tool based on the EWT, can be combined with the RSI and MACD tools in trading. Combining these tools help improve their overall accuracy in financial markets.
What are Impulse and Corrective waves
As already stated, the Elliott Wave Theory identifies two major waves which are the Impulsive wave and Corrective wave. Now let’s understand these waves a little bit more:
Impulsive waves
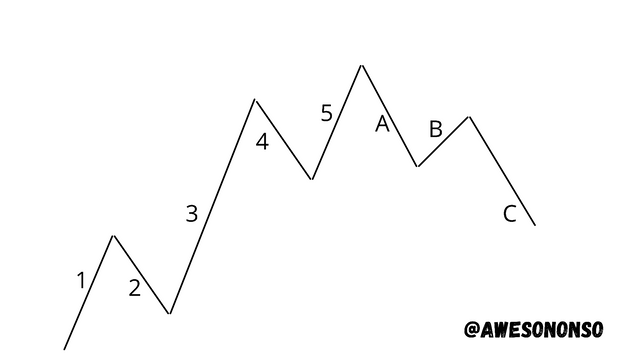
These are waves that define the overall movement of the market in any time frame. They show whether a trend is bullish or bearish as the move in the direction of the trend. These waves are five in total and are identified with numbers 1 to 5.
Wave 1: This is the first wave that starts the trend. At this stage, the asset is at a low price and so investors notice and buy. This causes the price to move up.
Wave 2: This is a little retracement of wave 1. At this stage, some traders are satisfied and therefore take profit leaving the market to briefly retrace. Traders can know best profit points with the Fibonacci ratios I explained earlier.
Wave 3: People tend to notice trends really quick. After waves 1 and 2, other investors would want to have a share of the cake. Crowd psychology, in this case, shows that that the mass would buy the asset thereby pumping its price. This wave is always the longest in the trend.
Wave 4: Just like wave 2, wave 4 is a small retracement of wave 3. At this point, some investors are satisfied and so they take profit leaving the price to retrace a bit.
Wave 5: This wave is caused by traders who FOMO into the market. At this point, the asset is overpriced but traders can still make small profits when the wave is complete.
Corrective waves
These are waves that generally move against the market trend. They are divided into three and are identified with the letters A, B and C respectively fo avoid confusion with Impulsive waves. Waves A and C are the waves that actually correct while wave B is a retracement of A.
Below is an illustration of the different waves in a bullish trend.
How the waves are identified
When identifying the Impulsive waves of the EWT, there are three general rules that need to be followed:
Rule 1: Wave 2 can never retrace past the beginning of Wave 1.
Rule 2: Wave 3 should be the longest of all 5 waves. It can never be the shortest.
Rule 3: Wave 4 cannot touch the price of wave 1.
For corrective waves, there are three patterns which they can be identified:
- Zig-zag pattern: In this type of pattern, wave B would be shorter than waves A and C as they appear in a zigzag pattern.
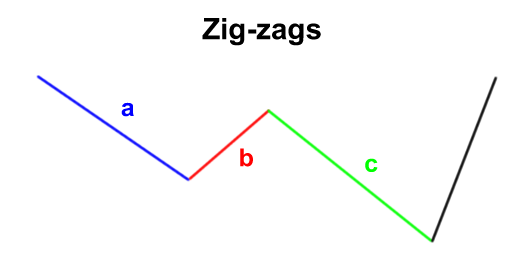
" Source
- Flat pattern: This type of pattern is noticed when all the waves are equal in length. This is probably the easiest pattern to identify since the waves would have a connection.
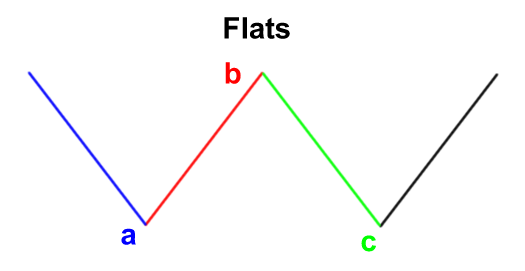
" Source
- Triangle pattern: This pattern is probably the hardest to find. In the triangle pattern, the waves either converge or diverge to form a triangular pattern.
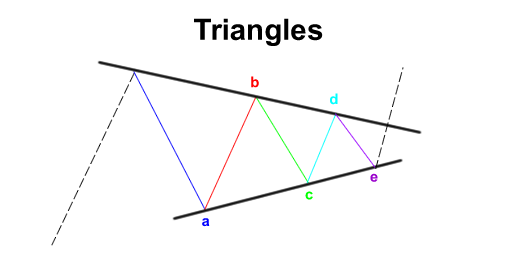
" Source
My thoughts on this theory
Elliott was diligent and patient to actually study charts of 75 years to come to some conclusions. Well, in my opinion I believe that the theory is really useful and versatile.
On the most of it, Elliott proved that psychology affects the market a lot. Greed and fear are two strong emotions that move people. Identifying that these emotions show up as patterns on the chart was ingenious on the part of Elliott. Traders these days can profit from the general crowd psychology thanks to the fact that this psychology or sentiments have become visible. Losses can now be mitigated and profits can be maximized.
Even with all the good points, I still have problems with the EWT. The fact that these patterns are hard to identify is a problem. Also, patterns differ on the different scales in the sense that there might be a downtrend in a short term frame and a uptrend in a long term frame. This type of theory will not be easy for newbie traders. The silver lining here though is that it would build diligence and inculcate hard work in traders. It takes seasoning to really master the EWT.
Elliott Waves on BNB/USDT chart
In this section, I would be analyzing the BNB/USDT pair on trading view. I will show the Elliott waves in a bearish trend.
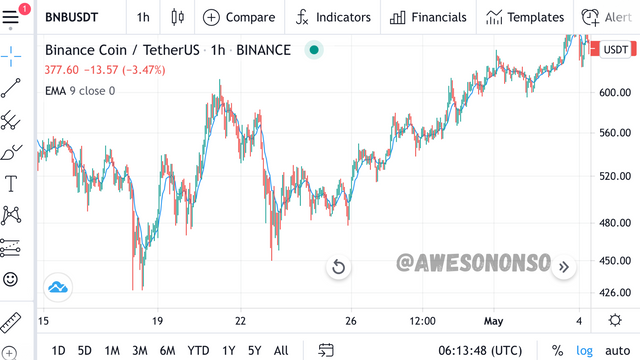
This is a 1 hour chart zoomed out
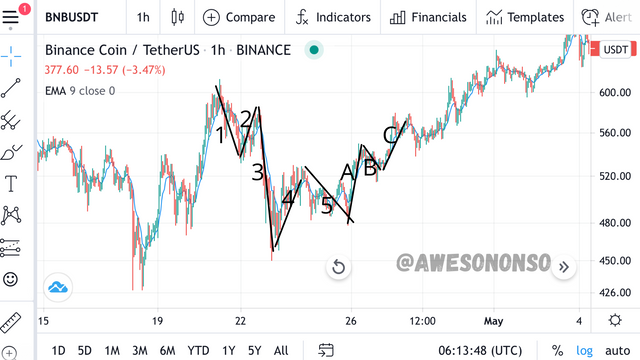
This is the part of the bearish trend
Let’s take the waves one at a time:
Wave 1
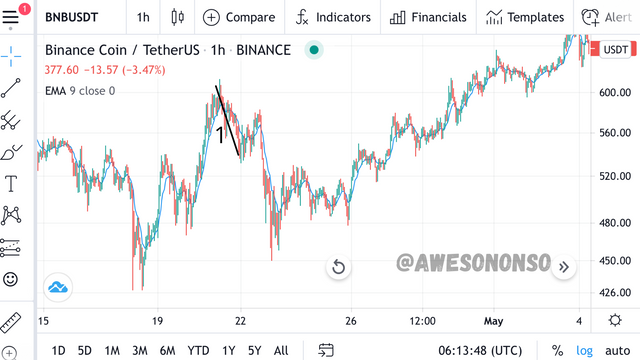
This is the wave that began the trend. Traders closed their position by selling off their coins. This caused the market price to decrease.
Wave 2
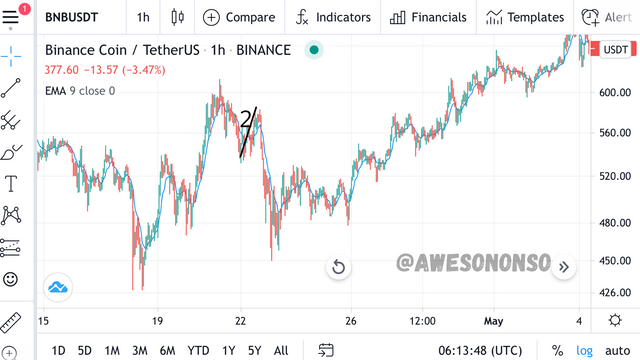
This is a retracement wave that happens because investors think the coin is cheaper and therefore take it as an opportunity to buy.
Wave 3
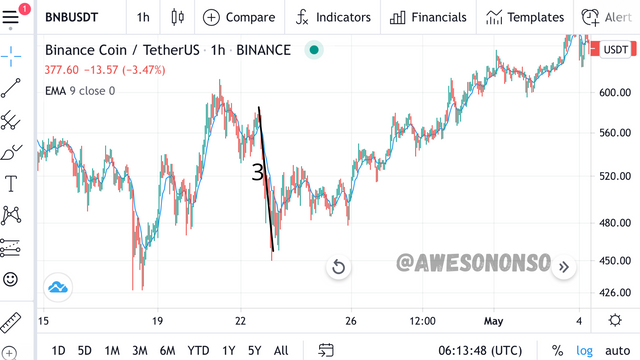
This wave is caused by investors who panic sell there coins to avoid further loss. This behavior drags the coin really low and makes the wave is longer than the rest.
Wave 4
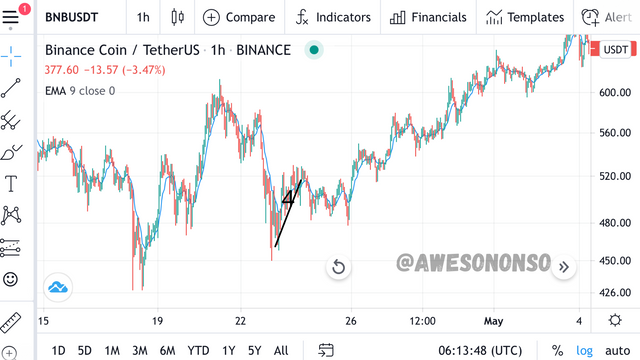
Just like in wave 2, there is a retracement because investors see an opportunity to buy lesser.
Wave 5

This wave is caused by some investors who would have given up on the market and would settly to sell at a major loss.
Wave A
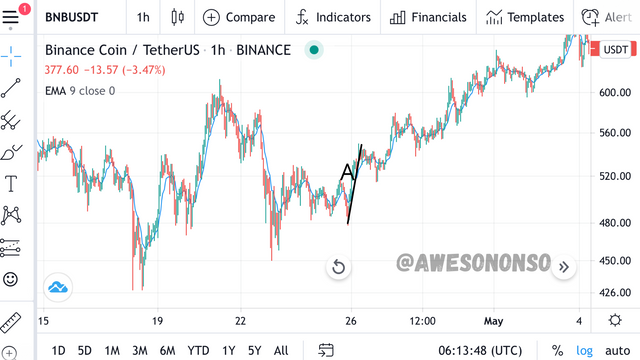
This wave begins the correction. Here investors buy the coin cheaper causing the market to go up.
Wave B
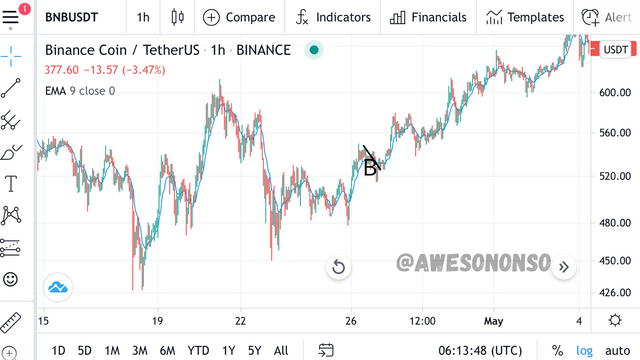
This wave is caused by investors looking to lock in any profit they can by selling off their coins.
Wave C
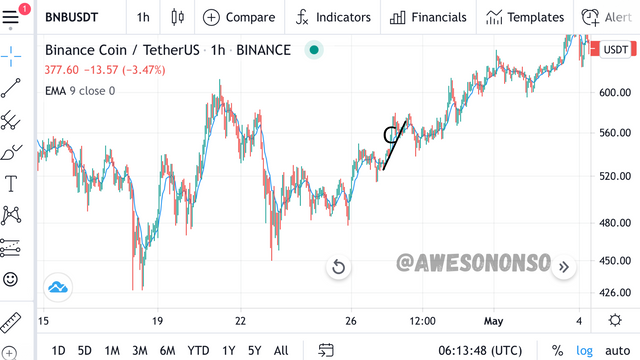
This wave is caused by bullish investors who buy the coins.
CONCLUSION
In the quest to make trading more convenient, a lot of tools, principles and strategies have been invented. The Elliott Wave Theory is just one of those many theories that have stood the test of time because of its reliability. Among all its benefits, it is still wise to remember that no tool or theory is 100% accurate.
Special thanks to @fendit
Thank you for being part of my lecture and completing the task!
My comments:
Well done!
Explanations were really good on the first task, but on the second one I wish you had included a bit more analysis on the chart, rather than just including screens!
Overall score:
6/10
Oh I had no idea. I would do better next time
Thanks