[Technical Indicators] - Crypto Academy / S4W2- Homework Post for @reminiscence01
Hello Everyone, this time I will write a homework to fulfill the task of Professor @lreminiscence01 regarding Technical Indicators
.png)
The tasks listed include:
a) In your own words, explain Technical indicators and why it is a good technical analysis tool.
b) Are technical indicators good for cryptocurrency analysis? Explain your answer.
c) Illustrate how to add indicators on the chart and also how to configure them. (Screenshot needed).a) Explain the different categories of Technical indicators and give an example of each category. Also, show the indicators used as an example on your chart. (Screenshot needed).
b) Briefly explain the reason why indicators are not advisable to be used as a standalone tool for technical analysis.
c) Explain how an investor can increase the success rate of a technical indicator signal.
[1.a] Explain Technical Indicators and why they are good technical analysis tools
Technical indicators are one approach to assessing the value of an asset or crypto. This assessment aims to make it easier for traders to "read" the movement of assets/crypto in order to make wise strategies and predict the next crypto price movement more accurately.
Technical indicators are influenced by several aspects, such as the previous up and down movement of prices, trading volume, trends and others.
With information on price movements up and down, trends, supply volume from this Technical Indicator, traders can catch signals and see gaps to enter offers so that they get profits with minimal risk, of course with various other aspects that support information from Technical Indicators.
Of course, this makes it very easy for traders to analyze the crypto market whose price movements change every second.
There are hundreds of types of Technical Indicators, among which the most popular are:
a. Moving Average
b. Relative Strength Index (RSI)
c. Stochastic
d. Moving Average Convergence Divergence (MACD)
e. and others
[1.b] Are technical indicators good for cryptocurrency analysis? Explain your answer.
Absolutely yes, this Technical Indicator is very good for analyzing the crypto market. The state of the crypto market, which has high fluctuations, can catch traders off guard. With the existence of Technical Indicators, traders get an idea of the potential ups and downs in the price of a crypto, so this can be the first alarm for market watchers to keep an eye on the targeted crypto.
Traders can be helped to make a decision to sell or buy a crypto, of course with other information variables. Even novice traders can get the basic information needed with this Technical Indicator.
[1.c] Illustrate how to add indicators on the chart and also how to configure them.
- First visit this web, then click icon "chart".

- After the web opens, select the type of crypto you want to see, here I choose Ethereum (ETH).


- Then select the "FX Indicators" menu.

- Then write down the indicator you are looking for, here I choose RSI.

- RSI indicator display.
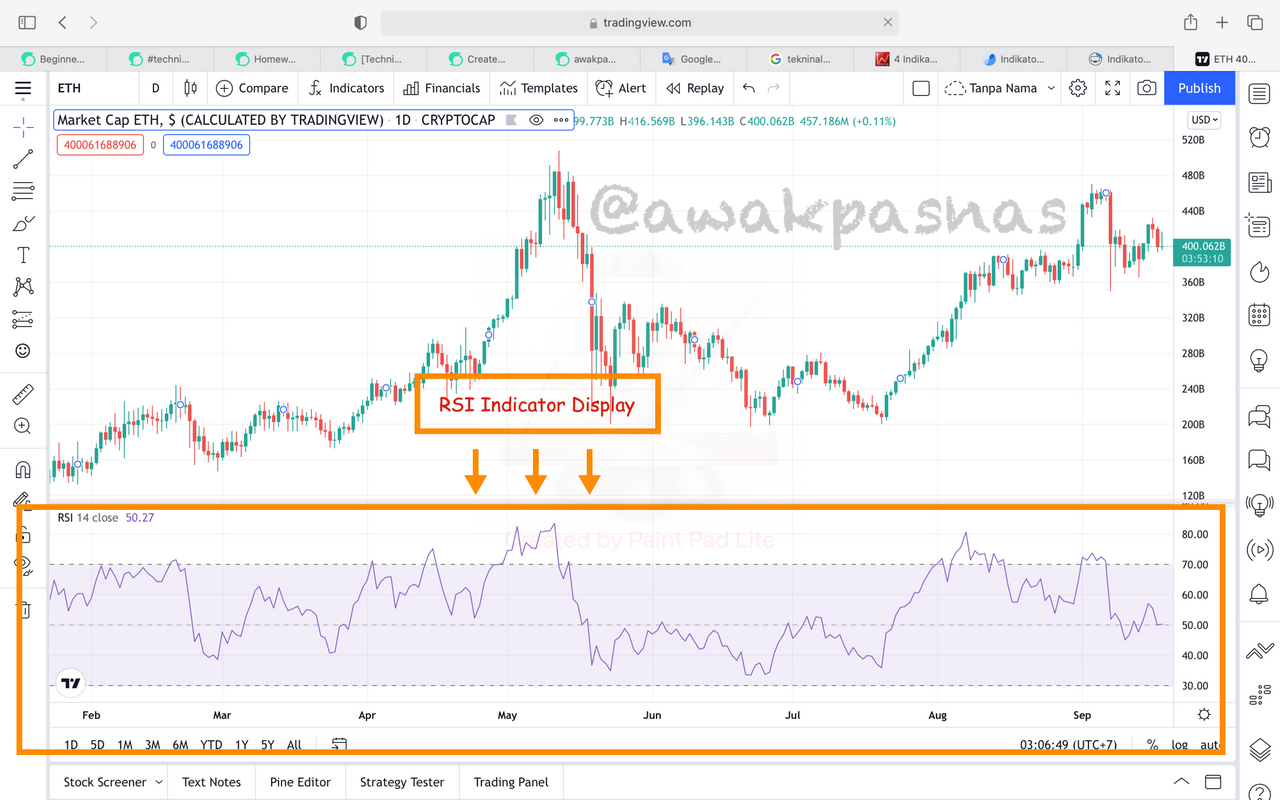
- You can change the appearance of the indicator data as you like.

- You can select changes in the "Inputs" "styles" and "visibility" menus.


[2.a] Explain the different categories of Technical indicators and give an example of each category. Also, show the indicators used as an example on your chart.
There are several types of indicators, their use depends on the needs and goals of traders. Of course, the more reference indicators used, the more accurate the results of the strategy will be.
Here I will explain the Momentum, Volatility and Trend Indicators.
- Momentum Indicator
This indicator explains the up and down movement of market prices, as the name implies, this indicator can show the direction of rebound or correction momentum to the observers. So he can predict future price movements.
The momentum of this indicator has a unique number limit, which can be used as a guide to sell or buy a crypto.
Some examples included in the Momentum Indicator:
a. Commodity Channel Index (CCI)
b. Relative Strength Index (RSI)
c. Stochastic Oscillator
Example of the Relative Strength Index (RSI):

- Volatility Indicator
This indicator is used to see the magnitude of the strength of market movements in a certain period. The more waves created on the chart the higher the volatility of the crypto.
Some examples are included in the Volatility Indicator:
a. Bollinger Bands
b. Standard Deviation
c. Average True Range
Examples of Bollinger Bands:

- Trend Indicator
As the name implies, this indicator takes advantage of the current trend in the market. Trends can predict when prices will shoot, reverse or fall by comparing historical data and predictions of future trends.
Some examples are included in the Trend Indicator:
a. MACD
b. Moving Averages
c. Parabolic SAR
Examples of Moving Averages:

[2.b] Why indicators are not advisable to be used as a standalone tool for technical analysis?
In fact, this Technical Indicator cannot stand alone, to determine our stance in front of the crypto market, we need to consider several interrelated aspects.
This Technical indicator is only a small part of the fundamentals in reading market movements, in order to get accurate predictions it would be wiser if we combine it with other indicators.
Everything can happen to the crypto market price that changes every second, studying more carefully and refraining from rushing to make decisions is the first step to avoid fatal risks.
[6] How an investor can increase the success rate of a technical indicator signal
An investor can increase the success of getting a definite signal with some supporting data. Never rush to catch a signal from just one Indicator.
It would be very unfortunate if we make decisions based on only one indicator, it would be wise if we consider 2-3 other supporting indicators.
If we understand how Technical Indicators work, aligned with other data information, then we will more easily read market movements, then our goal to get profit can be achieved.
Try it and you will understand, the more you sharpen it the sharper it will be, don't be afraid to try but stick with the data.
Conclusion
Try to consider several aspects and information from some data before deciding to sell or buy a crypto, the target is to make a profit, not to get stuck in the market cycle. Don't let it catch the wrong signal, end up in a loss.
Learn more about how to read market data, analyze carefully and again don't rush. It's natural to try and fail, but everything can be learned because market patterns will keep repeating themselves over time.
Hopefully this article can add insight from all of us, thank you to Professor @lreminiscence01 has shared his knowledge in this week's assignment.
Thank you for reading my blog, hope it will be useful for readers.
See you in the next post!!
Hello @awakpasnas, I’m glad you participated in the 2nd week Season 4 of the Beginner’s class at the Steemit Crypto Academy. Your grades in this task are as follows:
Observations:
This caught my attention as I was not sure what you meant to say.
Recommendation/Feedback:
Nice Job!
Thank you Prof.