Steemit Crypto Academy Season 3 - week 5 Homework post for Professor @allbert-Psychology and Market Cycle

Welcome to another wonderful episode in the crypto Academy community. Before I present my homework post, I would like to acknowledge the professors and the crypto Academy community for making such a wonderful poject. Today's topic is very technical Psychology and Market Cycle.
Without wasting enough time, I would present my homework post systematically based on the questions from the professor @allbert
1-Explain in your own words what FOMO is, wherein the cycle it occurs, and why. (crypto chart screenshot explanations needed)
FOMO is an abbreviation used in the stock market to represent Fear of missing out. This is a situation where traders in the stock market decides to purchase more of the asset with the perception that the price would rise. Usually when there's is an uptrend movement or a bullish trend, traders begin to give more attention to the asset in the bullish trend with the perception that, the price would continue to rise. From some technical analysis, we know that uptrends are either followed by distribution or downtrend. Hence any trader whose emotions triggers the urge to purchase an asset which is already in a bullish trend may fall victim and might probably run at a loss. Since there wasn't any technical analysis made on the asset before purchasing, the price could fall and the investor may lose money.
The FOMO is usually practiced by beginners or amateurs in the stock market. Because of thier little knowledge in technical analysis, when they see any asset in an uptrend for a while, they decide to join the the buyers with the perception that the price would rise and there would be profits.
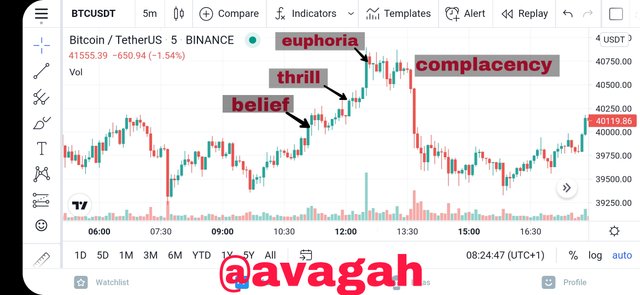
Typical example: let's assume that the price of an asset is $15. Within 3 days time, the price has just hit about $50 and still showing some signs of moving up. A trader saw the price 3 days ago and has just seen it hit $50 now. The trader begins to fear that he may be missing something good and decides to purchase the asset at about $55 thinking the price would continue to shoot. However, the price drop to $10 within the next 4 days. The trader would notice he made the wrong decision since the price was already at the climax.
Chart showing FOMO

2-Explain in your own words what FUD is, wherein the cycle it occurs, and why. (crypto chart screenshot explanations needed)
FUD is another abbreviation in the stock market that represents fear uncertainty and doubt. With the FUD, traders in the stock market begins to sell thier assets because of the continuous downtrend or the bearish trends. The fear of losing all the invested assets in the stock market triggers most traders do sell all thier asset and take the little profits. Half a loaf of better than non.
In the stocks markets, the prices of the assets are sometimes influenced by the Internet media. Sometimes there are some prominent news from the whales in the stock market which sometimes influences the general market. However, other people spread rumours and false news about the price of the asset which would sometimes tally with the trends. This types of situations influences some traders to sell thier stocks in FUD.
Chart of FUD
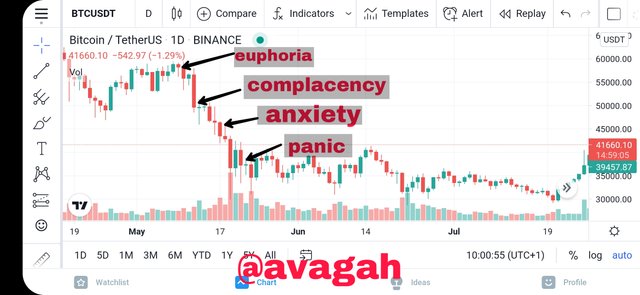
Considering the charts above, the FUD period usually occurs around the anxiety period where traders feel like they have no option than to sell the assets for profits rather than losing all.
Typical example: Let's assume a trader buys an asset at the thrill period where the price of the asset was around $15. Now the price rises and hit around $25 at the euphoria period. Now the price starts to drop and the price hits around $7 to $5. The trader begins to fear and starts to panic because of the bearish trend. The trader then go ahead to sell all the asset with the fear of losing more.
3- Choose two crypto-asset and through screenshots explain in which emotional phase of the cycle it is and why. Must be different phases
I would choose:
- Telcoin (TEL)
- Bitcoin (BTC)
Telcoin
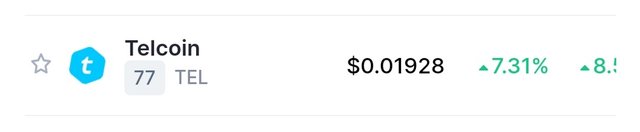
The Telcoin is currently at the 77th position of the current Altcoin rankings.
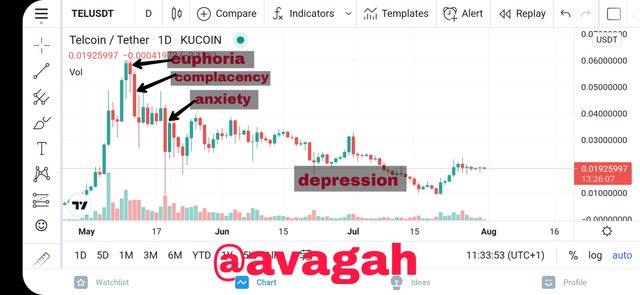
From the chart above, we can conclude that the price of the TEL is currently at the depression phase. Looking at the Telcoin's price now, its at one of its lowest point since the price hits $0.06 at the euphoria phase. However, looking at the Candlesticks at the end of the cycle, we can conclude that there could be a possible uptrend since most of the Candlesticks are green. The dominance is also increasing which proves that more traders are buying more of the asset. Hence, Buying or Holding the Telcoin at this phase isn't a bad idea.
Bitcoin
Bitcoin (BTC) is currently and has always been at the top of all coins rankings
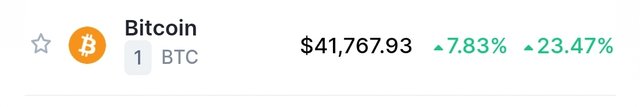
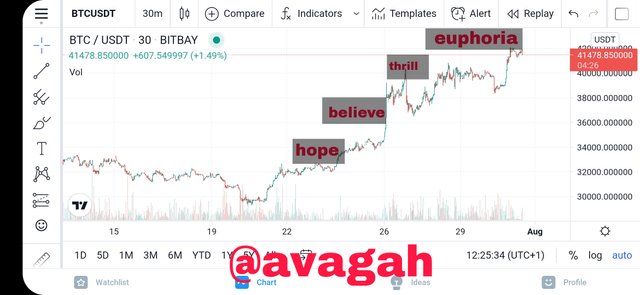
Looking at the 30 days Bitcoin chart, We can conclude that the chart is currently in a bullish trend. The chart of the BTC is currently showing some signs of a continuous uptrend therefore we can conclude that the trend is currently at the euphoria phase. Here, it's not advisable to buy the asset based on FOMO since the price could drop. At this phase, we presume the whales could sell thier holdings which could jeopardise the uptrend. However, considering the highest peak of the Bitcoin, we can also presume that the price of the Bitcoin could also rise since it hasn't reached climax.
From my experience, I would urge any one who wants to trade to make some Technical Analysis.
Do not invest money you are not willing to loose as well
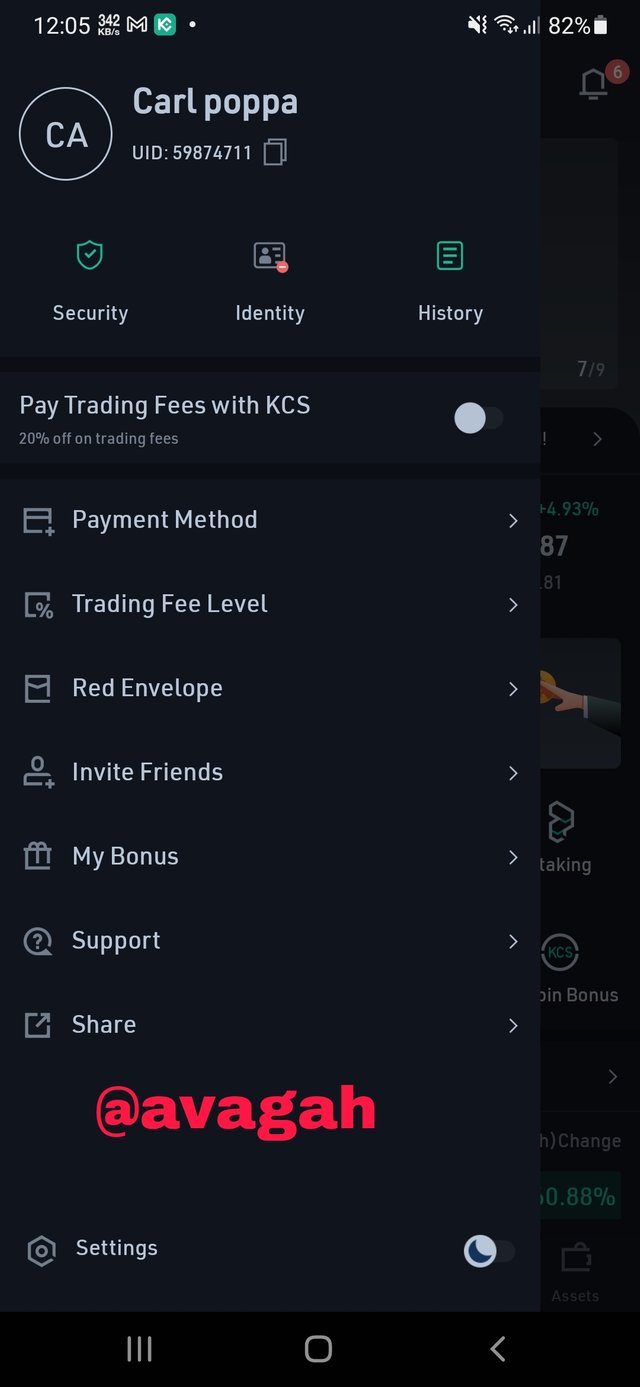
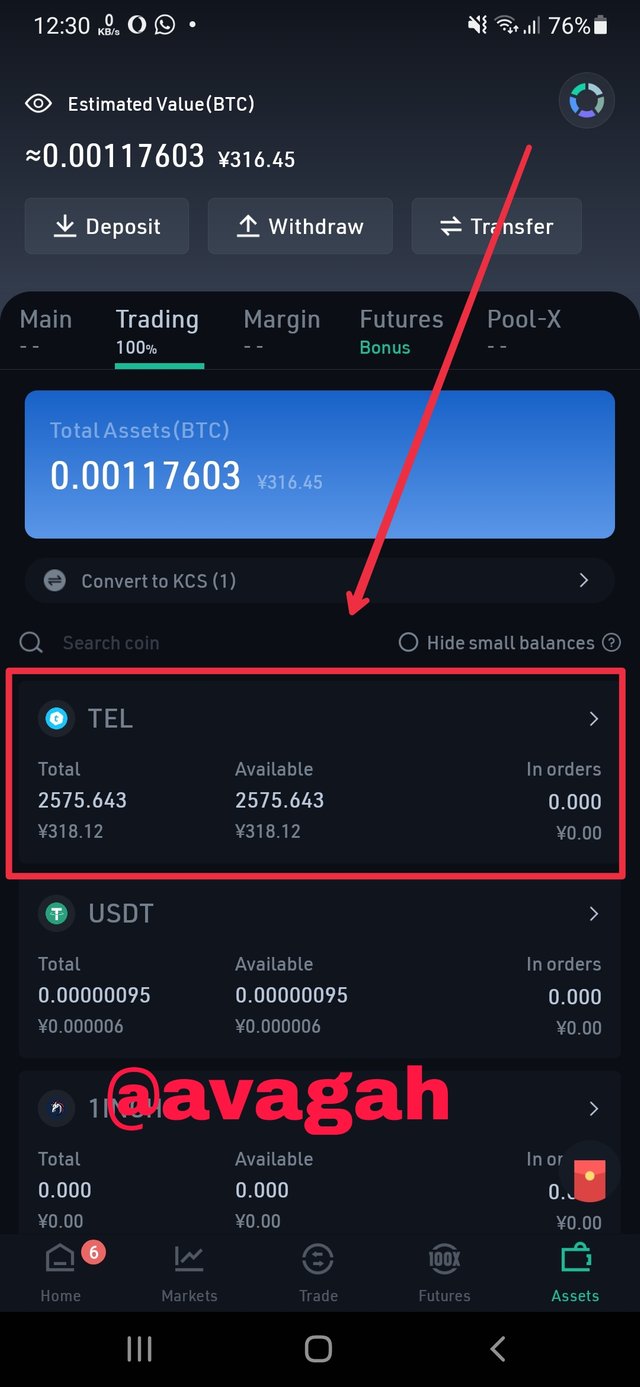
4- Based on the analysis done in question 3, and the principles learned in class, make the purchase of 1 cryptocurrency in the correct market cycle. The minimum amount of 5USD (mandatory), add screenshots of the operation and the validated account.
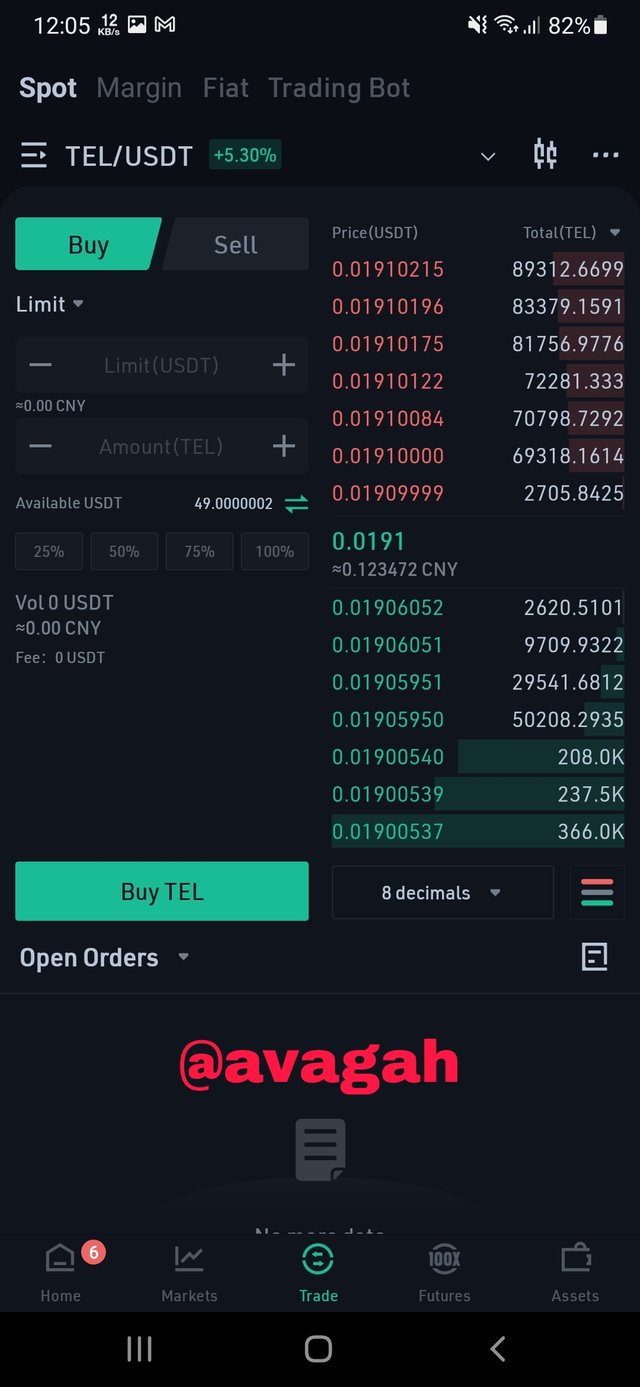
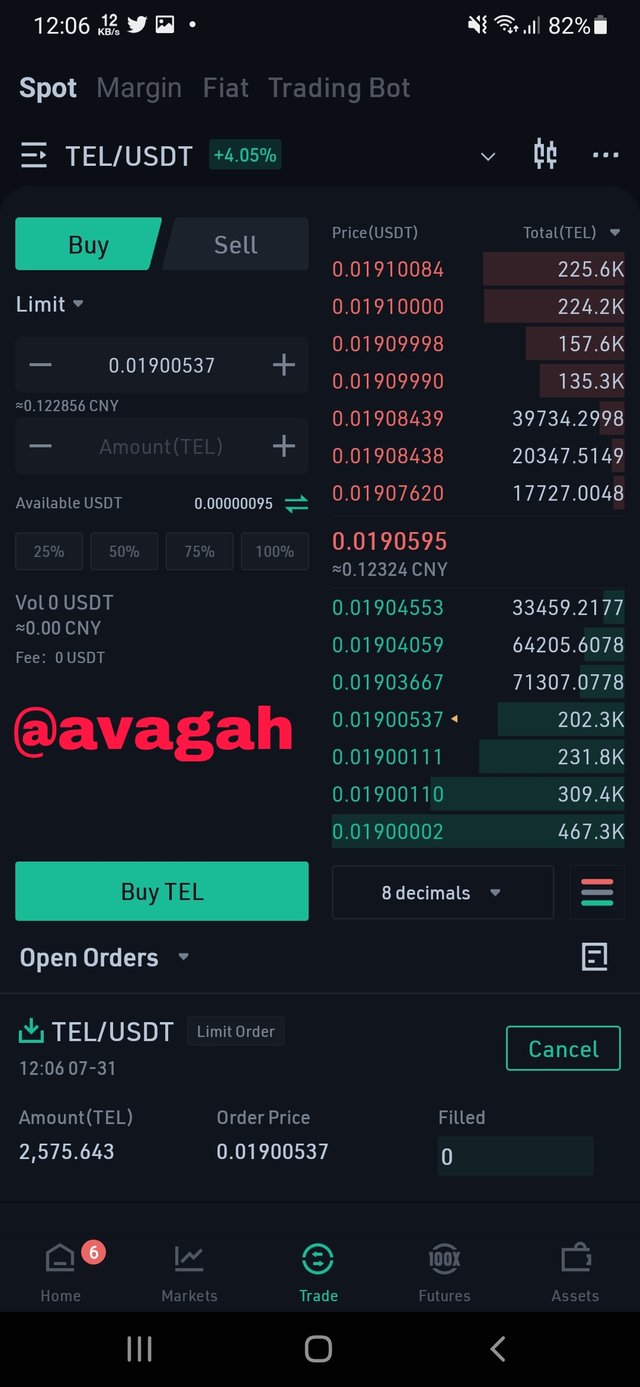
I would purchase Telcoin from Kucoin.
Steps involved to purchase Telcoin from Kucoin
Steps
- Open Kucoin
- login to your account
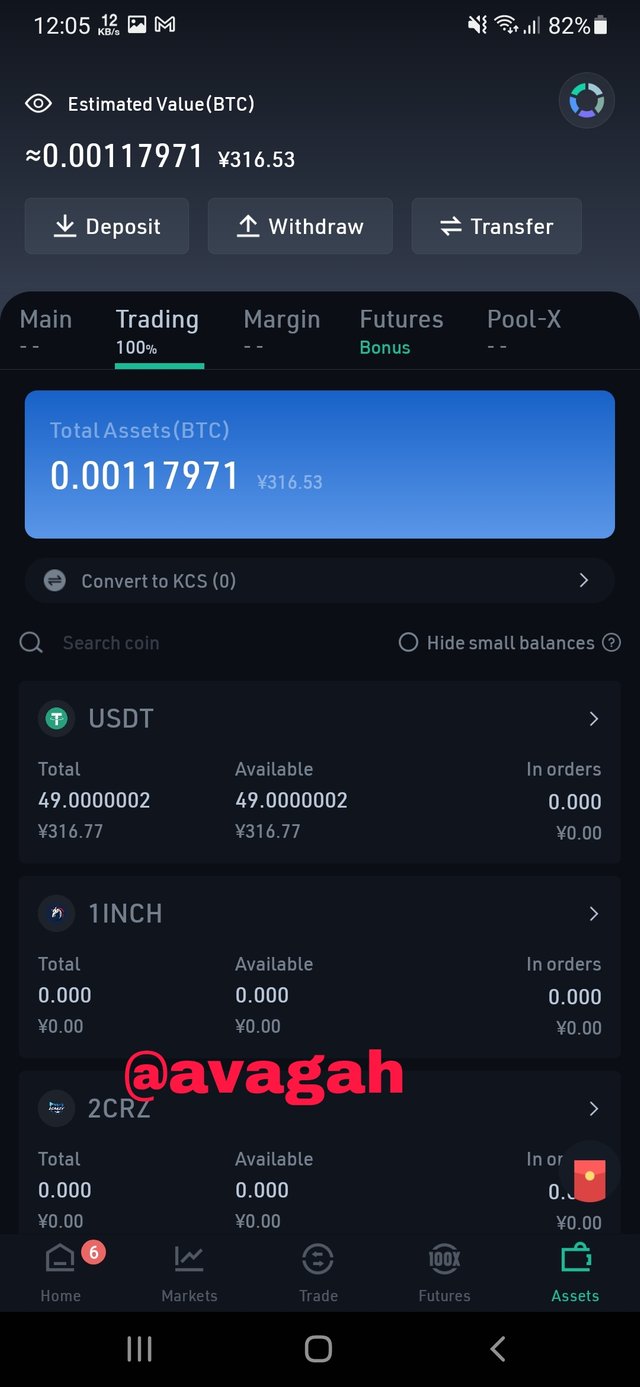
- click one assets from the bottom left
- make sure you have usdt in your trading account
- click trade at the bottom middle.
- select the Tel/usdt pair for the trade.
Conclusion
Overall I would say it a nice experience learning once again from professor @allbert.
Hello @avagah Thank you for participating in Steemit Crypto Academy season 3 week 5.
Thanks for the feedback