[Recognizing Simple Patterns in Trading] - Crypto Academy / S5W2- Homework Post for @sachin08
Welcome once again to another wonderful episode in the crypto Academy community. Before I present my homework post, I would like to acknowledge the professors and the crypto Academy community for making such an educative lecture possible. Today’s topic is simple Recognizing Simple Patterns in Trading
Without wasting enough time I would present my homework post systematically based on the questions from the professor @sachin08.

1. What is your understanding about Triangles in Trading. Explain all forms of triangles in your own words. (Screenshot required)
Crypto trading is now the order of the day. Traders in the crypto ecosystem use many technical strategies to aid in their trading. Others also use some technical indicators alongside their analysis to make trade entries and exits.
Triangles in trading is one of the technical strategies traders use to aid their trading. These triangles are shapes formed on the crypto chart. They are formed as a result of the activities of the traders available in the markets. The buying and selling force in the market causes these triangle shape patterns to form on the crypto chart. A clear understanding of these shapes could help you make a good trade. There are 3 different types of triangle shapes formed on the chart. Ascending Descending and symmetrical triangles.
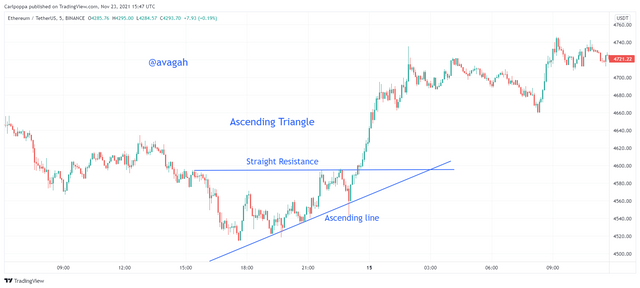
Ascending Triangles
As the name suggests, the ascending triangles connect two lines (the longest line from down to the top) in ascending order. The other line is also drawn horizontally on the chart above the longest diagonal line. The horizontal line is known as the resistance line while the diagonal line serves as the support line. The ascending line is drawn from the initial stage of the triangle to touch or cut the horizontal or resistance line at the top. When the price breaks the resistance line, meaning there's a bullish breakout which indicates a buy signal.
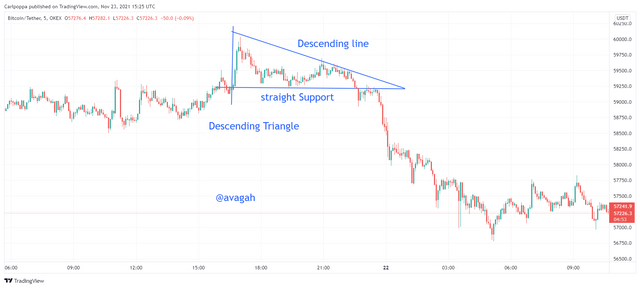
Descending Triangles
On the other hand, the descending triangles connect two lines as well. However, the longest line is drawn from top to down to touch or cut the horizontal line at the base of the triangle. Contrary to the ascending triangle, the horizontal line in the descending triangle serves as the support line where the price bounces off. However, when the price breaks the support line, it indicates a sell signal. In the mathematical explanation of the descending triangle, we can say a right-angled triangle where the hypotenuse is descending from the top left to the downright.
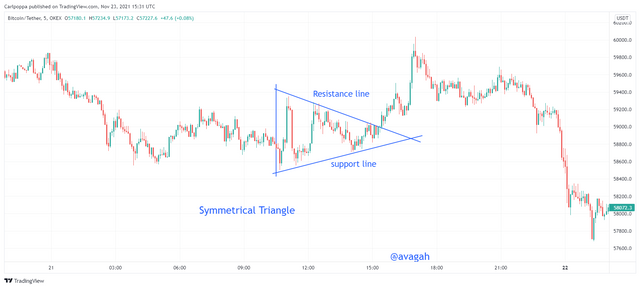
Symmetrical Triangles
Unlike the ascending and descending triangles where all can be classified as a right-angled triangle, the symmetric triangle can be classified more like an isosceles triangle where two of the sides are identical. The two sides are the support and resistance lines. With the symmetric triangles, the breakouts could either be in bullish trends or bearish trends depending on the type of candlestick that breaks either the support or the resistance lines.
2. Can we also use some Indicators along with it Triangle Patterns? Explain with Screenshots.
In trading, Technical indicators are essential tools used by technical analysts to make technical analyses alongside other technical strategies for trading. Technical indicators can be used alongside the triangle patterns to confirm signals to make better trades. In crypto trading, identifying strong signals for trading is the aim of every good trader. As we are all aware, no strategy in crypto trading can be 100% reliable and as such, it is best to use two to three technical indicators to confirm the signal for a better trade.
Indicators like the William %R can be used together with EMA to confirm trade signals from the triangle patterns. These are two different types of indicators that confirm signals in different ways.
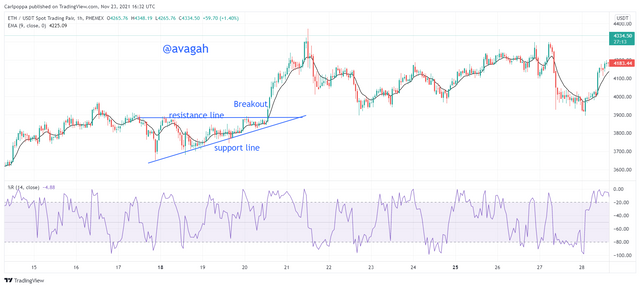
From the chart above, we used both the William %R and the EMA indicator alongside the ascending triangle. However, the William %R failed to confirm the buy signal but the EMA shows a clear indication that we can make an entry. In some cases, both of the indicators would confirm the signal.
3. Explain Flags in Trading in your own words and provide screenshots of both Bull Flag and Bear Flag.
Flags in Trading are also technical strategies identified on the crypto chart to analyze trading. The flags patterns are initiated by a strong price movement of the asset (Bullish or Bearish). Just after the strong trend, a triangle would be formed to look like a flag shape. The strong price movement of the asset constitutes the poll of the flap. That's with a bear flag, the flag would be turned upside down since the poll is a bearish movement.
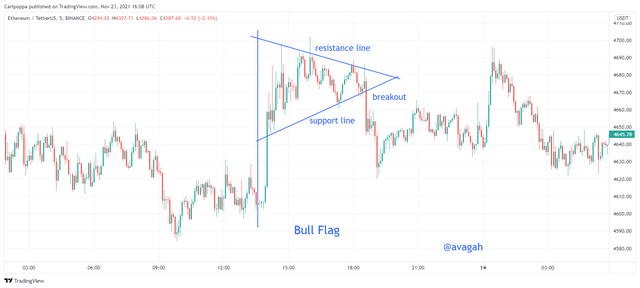
Bull Flag
A bull flag occurs after a strong bullish price movement. The strong bullish candlesticks constitute the poll of the flag. After the strong bullish price movement, a triangle would be formed at the top which combines with the poll to form the bull flag.
To make trades with the bull flag, we consider the two lines associated with the triangle and indicate our support and resistance levels. When the price break through the resistance level, we can make our entry whereas when the price break through the support level, we can equal make our sell trade. In any case, you can also confirm these signals with technical indicators.
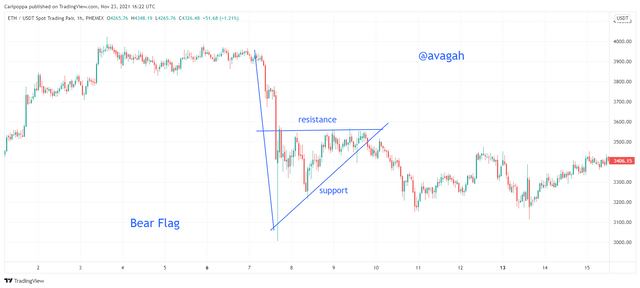
Bear Flag
On the other hand, A bear flag occurs after a strong bearish price movement. The strong bearish candlesticks constitute the poll of the flag. After the strong bearish price movement, a triangle would be formed at the base of the poll which combines with the poll to form a bear flag.
To make trades with the bear flag, we consider the two lines associated with the triangle and indicate our support and resistance levels. When the price break through the resistance level, we can make our entry whereas when the price break through the support level, we can equal make our sell trade. In any case, you can also confirm these signals with technical indicators.
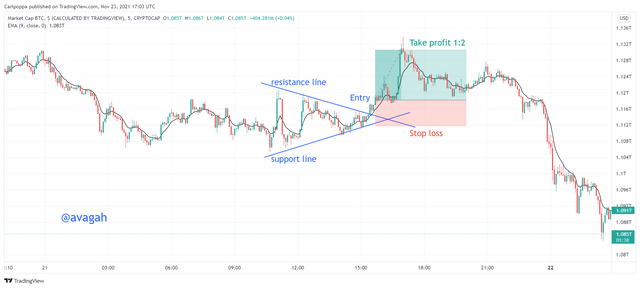
4. Show a full trade setup using these Patterns on any Cryptocurrency chart. (Ascending Triangle, Symmetrical Triangle, Bear Flag)
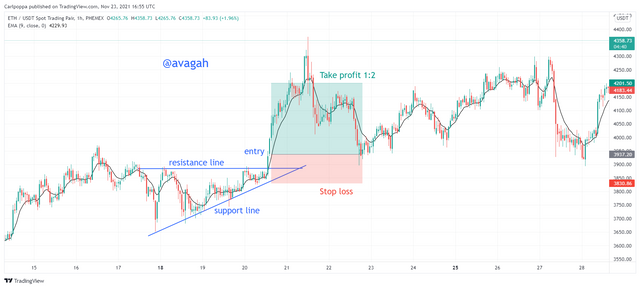
Ascending Triangle
For a complete setup trade,
- Identify a clear ascending triangle.
- Wait for a clear break of the straight resistance line.
- Place a buy entry when you identify a clear bullish candlestick
- Set a stop loss and a corresponding take profit.
Symmetric Triangle
For a complete symmetric setup trade,
- Identify a clear symmetric triangle.
- Wait for a clear break of the resistance line in case of a buy setup.
- Place a buy entry when you identify a clear bullish candlestick
- Set a stop loss and a corresponding take profit.
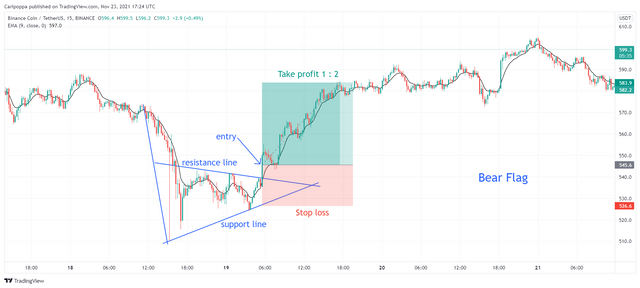
Bear Flag
For a complete setup trade,
- Identify a clear bear flag
- Wait for a clear break of the resistance line in case of a buy trade.
- Place a buy entry when you identify a clear bullish candlestick
- Set a stop loss and a corresponding take profit.
CONCLUSION
Most experts traders in the crypto ecosystem recommend these technical strategies than the technical indicators. From my experience, although technical indicators are very efficient and reliable, they seem to identify signals very late compared to the technical strategies like the Break Retest Break (BRB) and the Market Structure Break (MSB).
For Scalping traders, I think this lecture could be of great advantage to know more about identifying trend reversal very quickly for trading. Combining these strategies with MSB and BRB, I think It would improve your skills as a trader.
Overall, thanks for @sachin08 for making such and informative lecture possible.
Hello @avagah. Thank you for participating in Crypto Academy Season 5 Week 2 Beginner Course.
Feedback and Suggestions -
I appreciate your efforts and will look forward to see your next assignments.
Thanks for the feedback @sachin08
But my user name is @avagah not @tamighty
Corrected
Thanks for the correction
It was a great lecture indeed
Hope to continue learning from u @sachin08