Steemit Crypto Academy | Season 2- Week 8 | Homework Post for @kouba01 - Cryptocurrency trading with Bollinger Bands
Let me introduce myself before starting the homework task.
I am Atul Pathak lives in state-Bihar, India. I am an agriculturist and help farmers with different planting techniques.
I am also a crypto lover and I always try to learn different trading strategies.
This was a great lecture from @kouba01 about Bollinger Bands and I learnt to trade using this strong indicator today which will definitely improve my trading skills.
Thanks for this amazing lecture.
Now, I am starting to write my homework.

What is Bollinger Bands?
A Bollinger Bands is an indicator developed and copyrighted by an American financial analyst, John Bollinger. It is widely used in technical analysis to know the trend and volatility of an asset. It helps traders in identifying the overbought and oversold levels in the chart so that a decision can be made to open a trade with a higher possibility to achieve the target. Earlier it was called Trading bands but later John Bollinger renamed it as Bollinger bands.
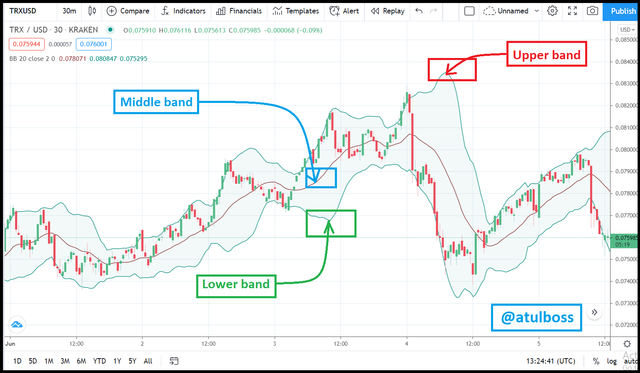
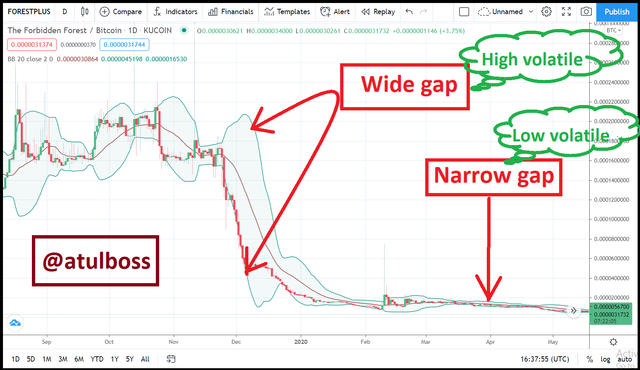
There are three bands in the Bollinger Bands indicator. All of the bands have unique importance. There is a security price line above which there is another line called the upper band and below which there is another line called the lower band. These upper and lower bands wrap the candles and make a volatility range in which the security price move either upwards or downwards. If we see the Bollinger bands on the chart, sometimes it shows narrow bandwidth but after some time it shows wide bandwidth. This shows that the volatility of asset changes with time. If it is wide that means the market is highly volatile but if it is narrow that means volatility is low.
Let's discuss all the three bands in detail one by one.
a) Upper band: The upper band acts as a resistance level and is formed by adding standard deviation by two in simple moving average(SMA).
b) Middle band: The middle band is the Simple Moving Average which tracks the trend of the market.
c) Lower band: The lower band acts as a support level and is formed by subtracting standard deviation by two in simple moving average(SMA).
There are two parameters on which Bollinger Bands depends, that is, Period and Standard deviation.
Default value which is generally used for Period is 20 and that of Standard deviation is 2 but a trader can make a change in these value as per his/her convenience.
Calculation involved in the formation of Bollinger Bands
So, Let's calculate Simple Moving Average.
To understand the concept of average, take an example of real-life activities. Suppose a man has 3 children. He distributed 5 chocolates to the first son, 8 chocolates to the second son and 2 chocolates to the third son. Then how will we find the average number of chocolates distributed to each son? We will simply add all the chocolate distributed to each son and divide this value by the number of sons.
So, here we will get the value equals (5+8+2)/3=5
Same as in the case of Moving Average
The value of Simple Moving Average which we use as default is 20. So the closing price will be taken and sum up from all the 20 days and divided to the total number of days that is 20.
Note:
*Short term traders use a 10-day moving average and bands at 1.5 standard deviations. (1.5 times the standard dev. +/- the SMA)
*Medium-term traders use a 20-day moving average and bands at 2 standard deviations. (2 times the standard dev. +/- the SMA)
*Long term traders use a 50-day moving average and bands at 2.5 standard deviations.(2.5 times the standard dev. +/- the SMA)
Now, Let's calculate Standard deviation.
The word Standard deviation simply means the fluctuations from any standard value. Here in Bollinger bands, we have taken the Standard value equals 20 which is a Simple Moving Average.
This deviation may be positive or negative. For positive deviation, we will add 2 in SMA value and for negative deviation, we will subtract 2 in SMA value.
Workings of Bollinger bands
1). Volatility Indication
a) When the upper band and lower band starts separating it is an indication of an increase in volatility, however, when those bands start getting narrow, it is an indication of a decrease in volatility. An increase in volatility is the possibility of a change in an existing trend.
b) Price tends to move within the bands called envelope. Once it touches the upper band, possibly it will move to the lower band. A trader usually open trades at these points.
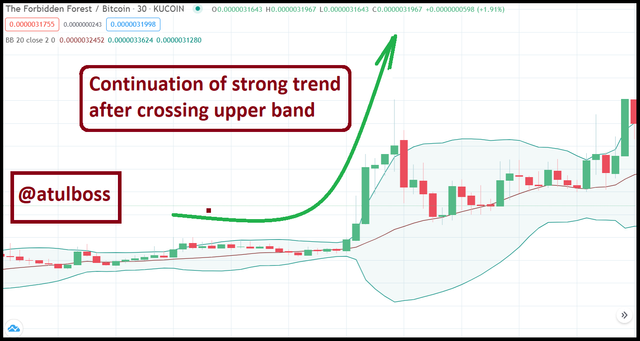
c) If the price movement is huge and it broke either the upper band or lower band, the possibility of a strong trend may occur.
d) Long time narrow bands leads to a significant rise in the price of an asset after some period. In the narrow bands, the upper band and the lower band come close to each other and squeeze the simple moving average. It is expected that after the end of a squeeze there is a remarkable rise in price can be seen.
2). Indication of oversold and overbought zones
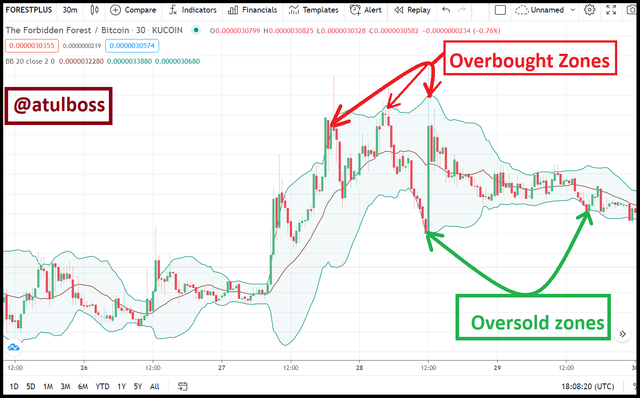
a) Overbought zones: It is the condition when an asset or coin moves upward and its price reaches its peak and touches the upper Bollinger bands, it may be considered as Overbought zones. At this point, it is believed that an asset is bought by buyers at their maximum and now there is the possibility that traders will sell it. So, there is a possibility of a remarkable fall in price due to selling pressure.
b) Oversold zones: It is the condition when an asset or coin moves downwards and its price touches the lower Bollinger bands, it may be considered as Oversold zones. At this point, it is believed that an asset is sold by the seller at its maximum and now there is the possibility that traders will buy it. So, there is a possibility of a remarkable rise in price due to buying pressure.
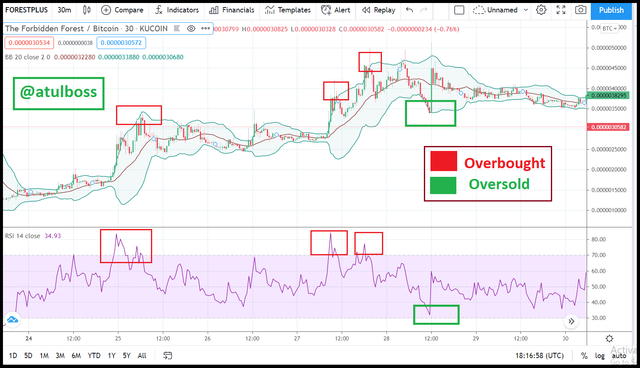
For more confirmation, traders apply the Relative Strength Index(RSI) with the Bollinger bands in the chart. RSI is considered as overbought when above 70 and oversold when it comes below 30.
There are also some other workings of Bollinger bands like the formation of support and resistance level and break out of the bands, which will be discussed in the latter part of this assignment only.
Best Bollinger band setup
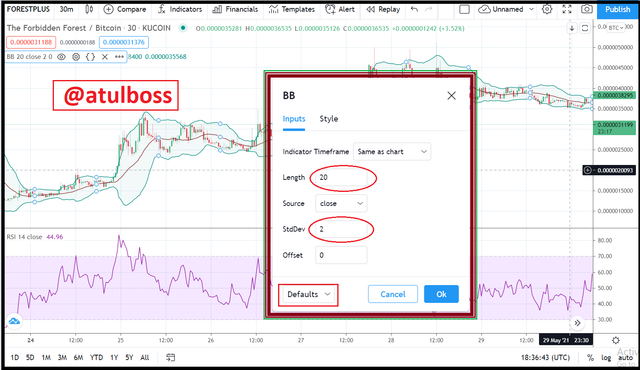
I am using https://www.tradingview to show the setup in Bollinger bands. Here I am using default setting in Input and Style
In Input, length value equals 10 and standard deviation equals ±2 has been kept. This is the default setting.
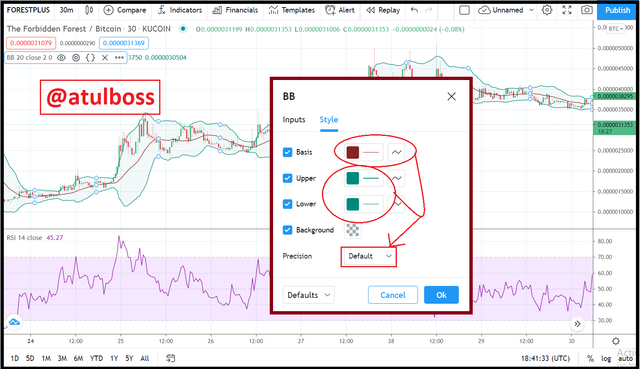
In Style, the Colour of the upper and lower band can be changed at your convenience. I keep it default.
What is a breakout and how do you determine it?
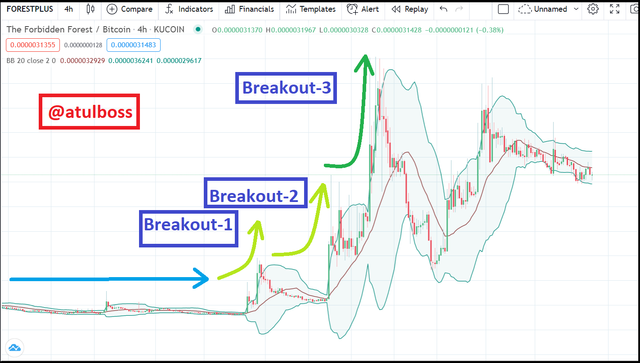
Breakout is actually an outbreak of the price of an asset beyond resistance and support level.
Usually, in a medium volatile asset, the breakout takes place within the wrap of the upper band and lower band, but in case of an increase in volatility, sometimes the price crosses the boundary made by Bollinger bands. This is determined as the Breakout of the asset or cryptocurrency.
Also, it is possible that sometimes after breakout a sudden trend reversal takes place which proves the previous breakout as fake.
I have shown this situation in the screenshot below. Here the trend is reversed immediately after the red candle touched the lower band.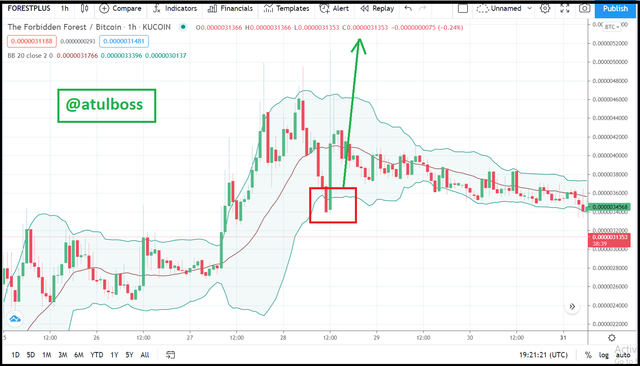 This was the technically determining breakout.
How to use Bollinger bands with a trending market?
A trending market means the market is moving in some trend either upward or downwards. The upward market is termed a bullish market and the downtrend market is termed a bearish market.
In Bollinger bands, out of three bands, the middle band also play an important role. The middle band is actually Simple Moving Average which is used for analysing trend.
We will see the picture representing the Uptrend and downtrend separately.
Uptrend Market
In an uptrend market, when middle lines show uptrend and the market come a little bit down and take support from the middle band, it is a good signal to traders to buy that asset.
In the below screenshot, I have tried to show the support and pullback of the market.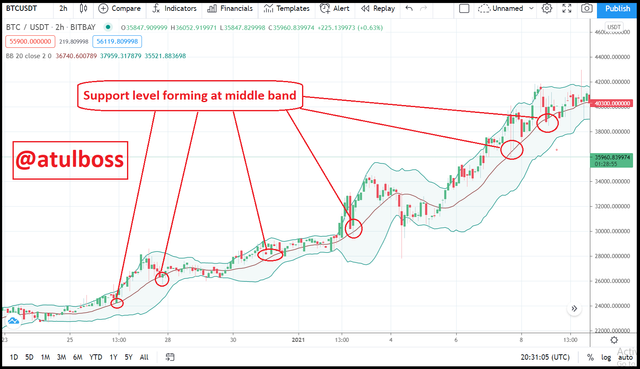 Also, there is a good opportunity to buy the asset when the candle touches the lower Bollinger band. A trader should keep in mind that never go against the trend in the trending market.
Downtrend Market
In a downtrend market, when middle lines show a downtrend and the market come a little bit up and feel resistance from the middle band, it is a good signal to traders to sell that asset.
In the below screenshot, I have tried to show the resistance and pullback of the market.
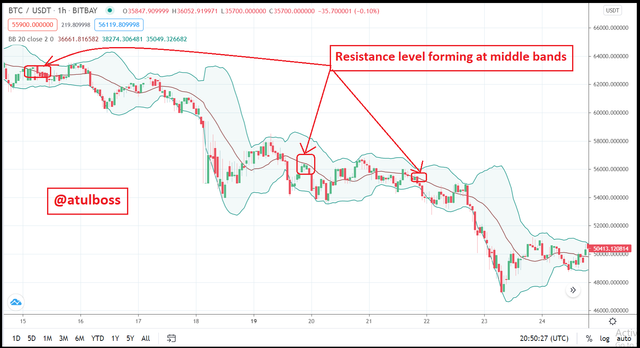
Also, there is a good opportunity to sell the asset when the candle touches the upper Bollinger band.
Best indicator to use with Bollinger Bands to make trade more meaningful
Bollinger bands are itself a strong indicator that identifies trends as well as market volatility but no indicator is 100% perfect. Sometimes it starts giving the wrong signal which may result in loss to the trader.
I use Relative Strength Index with Bollinger bands which are a perfect combination with each other. For more confirmation in signal, I also add a MACD indicator. I am showing this in the screenshot that how the combination of three indicators results in the almost perfect signal.
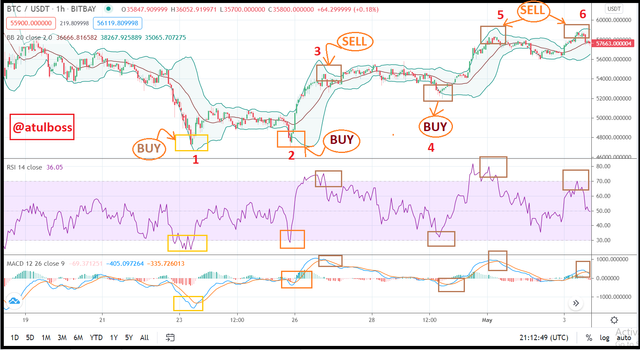
Now, let me explain what details are in the screenshot.
I have given numbers to every signal from 1 to 6.
In signal 1, 2 and 4
candle is touching the lower Bollinger band, this means this is oversold.
RSI is touching/crossing 30 lines, this means this is oversold.
MACD is below the signal line, this means the market is tending to move upwards.
All three indicators are giving a signal of BUY, this means a trader should BUY.
In signal 3, 5 and 6
candle is touching the upper Bollinger band, this means this is overbought.
RSI is touching/crossing 70 lines, this means this is overbought.
MACD is above the signal line, this means the market is tending to move downwards.
All three indicators are giving a signal of SELL, this means a trader should SELL.
NOTE: Using more than three indicators usually create confusion so most traders avoid this.
The time frames on which bollinger bands work best
Bollinger bands work best in all the time frames available in the chart. I have used 30 minutes, 1 hour, 4 hours, 1 day, 2 days time frame in all my above screenshots and it worked good. Now, the thing is what is the actual need of traders and which type of trade he is going to open either swing trade, day trade or long term trade. In every condition choice of time frame may vary.
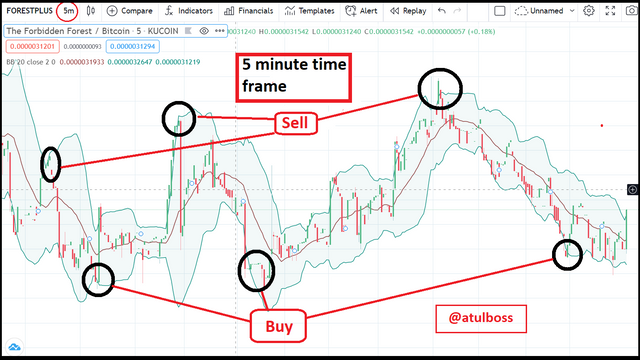
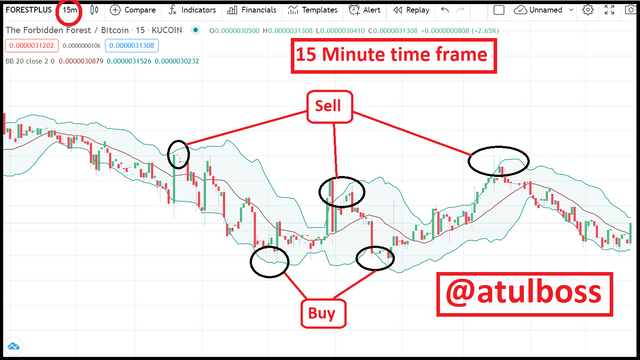
If a trader is going to open a day trade, the lower time frame like 5 minutes or 15 minutes timeframe will be used in Bollinger bands.
For Swing trading or position trading, 1D or 1W timeframe will be chosen for best signals.
I am showing screenshots of 5 minute and 15-minute time frame which can be used for day trade. Rest all the time frames are shown in the screenshots above.
Reviewing a chart of TRX/USD chart with bollinger bands
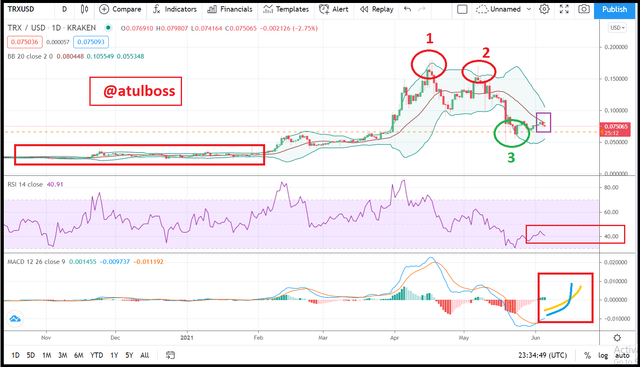
In the above screenshot, we are able to see in 1 and 2 signal, after being in overbought level, the market moved downwards, this was a technique to check that our indicator is working perfectly or not in a particular time interval.
Now, In signal 3, we are able to see that market is now at an oversold level, so there is a probability of rising in price from this level. For confirmation of this signal, we are looking to RSI. In RSI, we are looking that RSI is near 30 levels, which indicates that the market is at an oversold level. This means this is confirmed a buy signal.
For one more confirmation, We are looking into MACD. Here, the blue line is crossing the yellow line in an upward direction. This means from all three signals, it is confirmed that the market will move up from this level. This is a STRONG BUY signal.
Conclusion

Hello @atulboss,
Thank you for participating in the 8th Week Crypto Course in its second season and for your efforts to complete the suggested tasks, you deserve a 9.5/10 rating, according to the following scale:
My review :
An excellent job, well done answering all the questions with great analysis of the charts provided by tracking the price movement of the pair. Following a clear methodology and a set of accurate information enabled you to get the highest score.
Thanks again for your effort, and we look forward to reading your next work.
Sincerely,@kouba01
Thank you dear sir @kouba01 for reviewing my homework. I love reading about crypto and after solving the homework questions all the facts got cleared now.
Again thanks for this great lecture.