Steemit Crypto Academy | Season 2: week 7- The Swing trading style- Homework work by @yohan2on
Greetings to Respected professor @yohan2on and dear steemitian friends.
Let me introduce myself before starting the homework task.
I am Atul Pathak lives in state-Bihar, India. I am an agriculturist and help farmers with different planting techniques.
I am also a crypto lover and I always try to learn different trading strategies.
This was a great lecture from @yohan2on about Swing trading style and I learnt many new things today.
Thanks for this amazing lecture.
Now, I am starting to write my homework.

Swing Trading
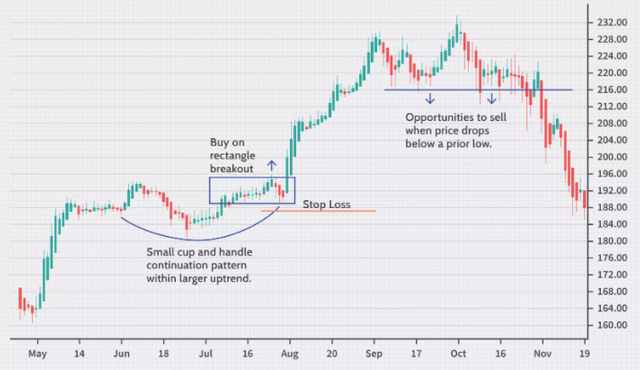
We know that market always show a zig-zag motion in every time frame whether it is crypto, stock or forex. Volatility and stability is another property of the market. This means sometimes the market show rapid fluctuations in short time frame candles. A professional trader captures these types of swings in the market at different time frame and makes an entry in the market for a day, a week or sometimes a month. These entries are based on mostly proper technical analysis of charts and sometimes fundamental analysis can be also taken into consideration for price trends and pattern
Key points to remember while trading in swing style
*This style of trade can last a couple of days to several months. (unlike scalping)
*While doing swing trade, the role of proper risk and money management can not be ignored.
*Use of indicators in different time frame can result in better profit achievement.
My expectations
Here profit can be expected between 10-50% if done with proper risk management(We will also discuss risk management in brief in this homework). Expecting huge profit may result in reversal of market to the buying zone and then no profit can be achieved.
My trading plan
-My chosen crypto-asset pair:
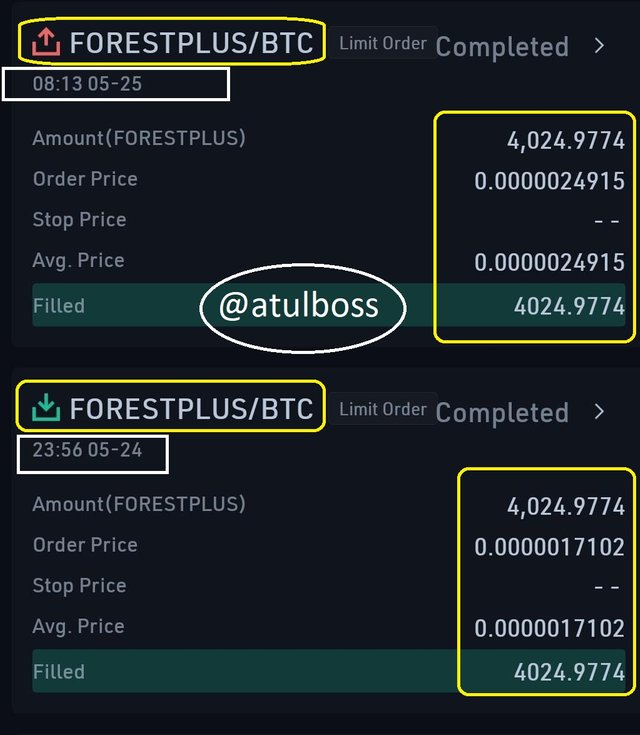
I am writing this post after doing a swing trade on a coin "FORESTPLUS/BTC listed on Kucoin Exchange. So, here I will show a practical example of my plan with some screenshots. I took entry after analysing strong support and took the exit and good profit point. Please have a look at the screenshot. Trade has initiated on 24th May 2021 at 11:30 PM (Indian Time)
Entry and exit strategy
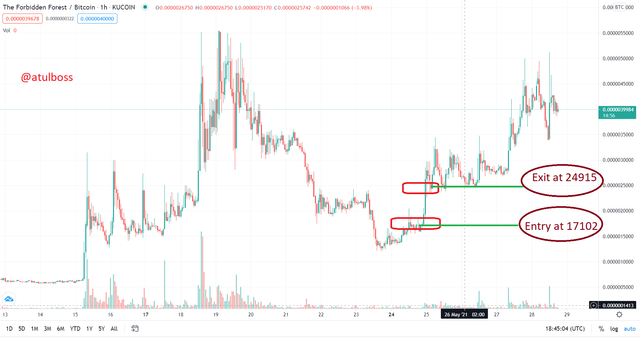
In this trade, I entered at 171.02 and took the exit at 249.15 and got 45.68% profit.
Let's discuss strategy.
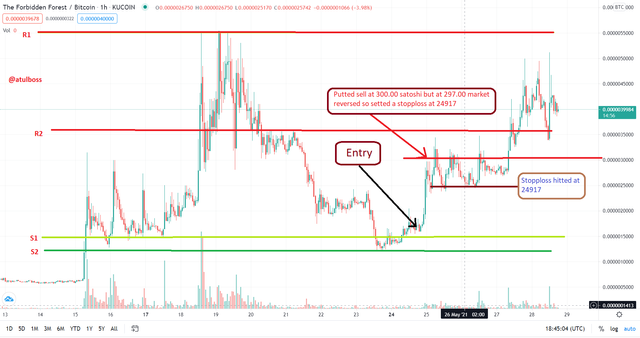
I analyzed Support and Resistance at the various time frame and found that this coin was standing at the strong support level so I took entry in the FORESTPLUS/BTC pair at 171.02 satoshi price and took the exit at minor resistance zone at 249.15 because there were chances of pullback because of resistance in FORESTPLUS coin as well as high volatility in BTC/USDT pair due to FUD announced at 24th may 2021(fundamental news may create impact in altcoin). I am showing support and resistance lines after drawing and analysing it technically of this pair at a 1-hour time frame.
Please have a look at the screenshot.
These are the screenshots taken from the website of www.tradingview.com https://www.tradingview.com/chart/?symbol=KUCOIN%3AFORESTPLUSBTC
Let's discuss Risk & Money management in trade
By analysing at S/R, I became clear about entering this trade. I set a stop-loss at 156.32. If the market would take reversal I have to bear a loss of 8.6% and in the case of profit that would be 46%. So, it was clear cut 5:1 reward to risk ratio.
A trader can also set a trailing stop loss to maximise his profit but I didn't apply the trailing stop loss because in Kucoin Exchange we get no facility to set trailing stop loss.
Multiple time frame analysis
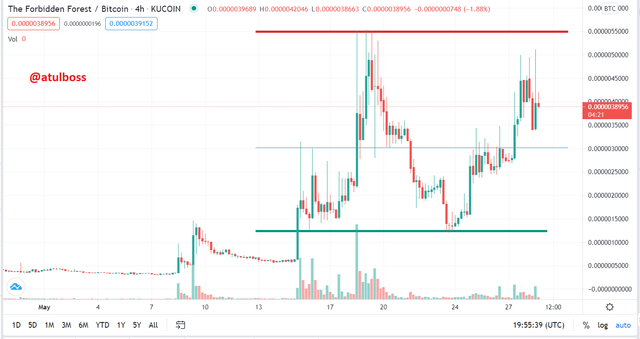
I have given screenshots of a 1-hour and 4-hour candle chart. I focused mainly on two time frames because I didn't want to hold the trade for midterm (>1 week).
Candlestick analysis and use of relevant supporting indicators
Along with S&R, I also focussed on some indicators like Moving Averages of different length(8, 34, 200). Please have a look at the screenshot below.
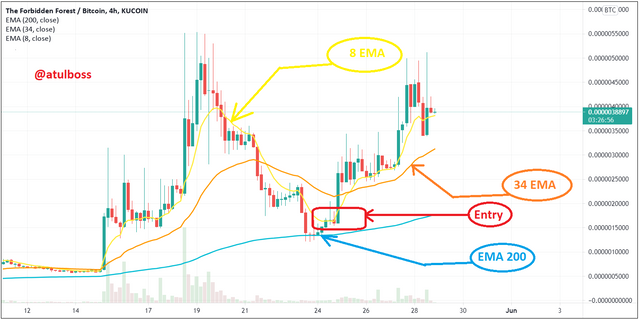
Reason to enter in trade at this point
- Strong Support
- 200 EMA touching the base of green candle that is an indication of the pump in the market from this level.
- Reversal from the downtrend in 8 EMA is the possibility of starting the uptrend.
Results:
I got 46% of net profit because of hitting stop loss at 249.15 satoshi. Sometimes due to low volume, even after touching SL our coin do not sell. So, a trader can manually sell the coin below 1-2 satoshi SL price as I did.
This was all from my side. Thanks for reading my post.
Hi @atulboss
Thanks for participating in the Steemit Crypto Academy
Feedback
With Swing trading 1 and 4-hour timeframes are not enough to look at if you are considering holding a trade position for a good number of days. 1 and 4-hour time frame are ideal for day trading and Not for Swing trading. While doing a multiple time frame analysis, you start from the higher time frame coming down to the lower time frame where you place your entry.
Homework task
5
Thanks for review
#affable #india