Crypto Academy Season 3 | Intermediate Course: Spotting Market Reversals With CCI |Course by professor @asaj
Greetings to Respected professor @asaj and dear steemitian friends.
Let me introduce myself before starting the homework task. I am Atul Pathak lives in state-Bihar, India. I am an agriculturist and help farmers with different planting techniques. I am also a crypto lover and I always try to learn different trading strategies.
Now I am starting my homework.

With this hope that I will be successful in explaining all the tasks that may help another reader also learn this basic strategy, I am starting to write it pointwise as asked.

Question 1.
I am trading since the year 2017 and am little aware of the technical analysis of the market. I have used MT4, MT5 but this time I will use FXCM to learn something new.
Now I will open a demo account on the FXCM using the link. On clicking this link, we will be redirected to the FXCM website and there we will find TRY FREE DEMO.
Simply put Email and select country and then we will receive an email with LOGIN ID and Password.
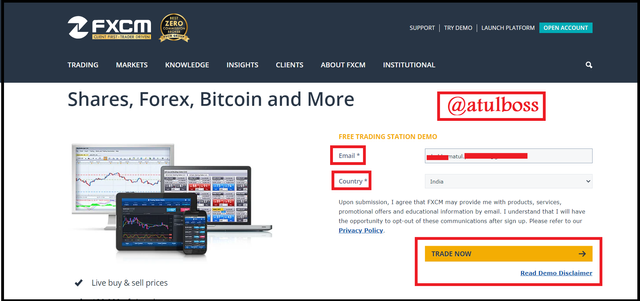
We can also download free software for PC which is available on the website. It gives an easy user experience.
After downloading, put LOGIN ID and Password and sign in.
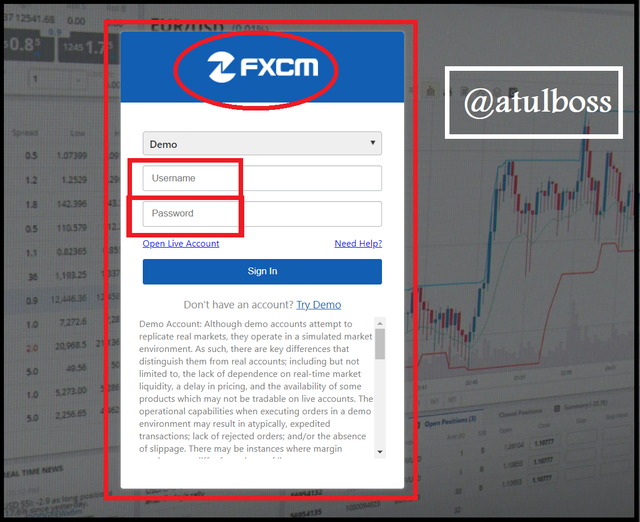
After LOGIN, we will see the default view. Here we get the free balance of $20000 in the demo account for learning the trade and making the strategies.
In the default view, the EUR/USD currency pair is open but we can choose different assets like stocks, commodities, cryptocurrencies and also FOREX pairs.
On the left side of the window, we can see the Tools where different indicators, zoom in, zoom out, draw line etc can be used.
On achieving the expertness we can upgrade our account to Real Account by clicking UPGRADE NOW.
More interestingly, we get an option to Quick Buy/Quick sell.
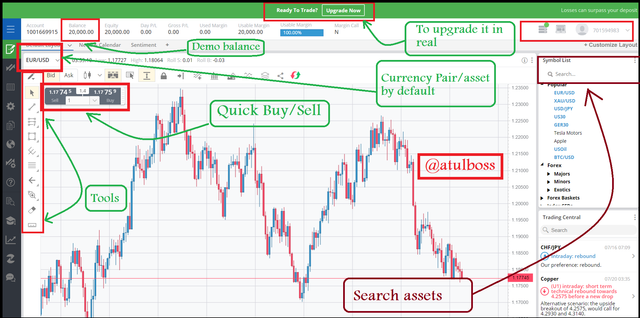
On the right side of the window, we get an option to search assets.
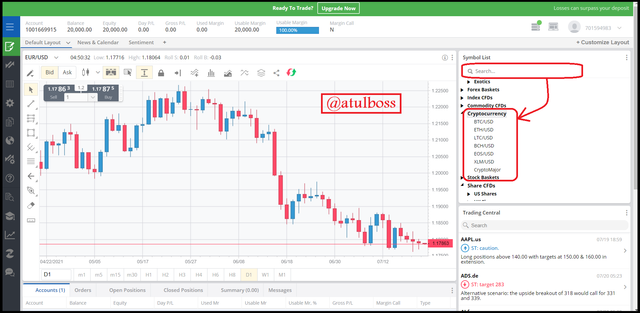
Here, I have selected 5 different cryptocurrencies as asked in the question.
I have selected Top cryptocurrencies which is BTC/USD, LTC/USD, XLM/USD, ETH/USD and BCH/USD.
Question 2.
Now in this part of the task, I will discuss the trading strategy which I am going to follow.
Here to trace and enter the market, we will follow three signals,
a. Analyse the trend.
As taught by my professor @asaj, when the uptrend crosses the downtrend, this will be the point of entering into the trade. On reversal, when the downtrend crosses the uptrend, this will be the point of exit from the trade.
b. Analyse the CCI Indicator (for signal).
In the CCI indicator, I will consider -100 or below as the point to enter the trade because it is an oversold zone and +100 or above as the point to exit from the trade because it is an overbought zone.
c. Follow the MACD Indicator (for signal confirmation).
I will use MACD to confirm the entry because sometimes CCI may give false signals. Not any indicators are 100% perfect but if we use 2-3 indicators for signal confirmation, we get maximum accuracy in trading.
Qustion 3.
The below screenshot shows, I have made an entry with 1 lot of available demo balance in all of the cryptocurrencies chosen. Also, I have used the same strategy which I have discussed in Question 2.
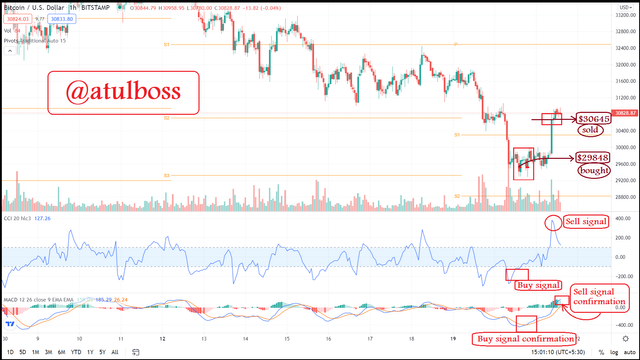
BTC/USD trade showing entry and exit
LTC/USD trade showing entry and exit
ETH/USD trade showing entry and exit
BCH/USD trade showing entry and exit
XLM/USD trade showing entry and exit

Qustion 4.
I have opened 5 trades using the same strategy and fortunately, I got the profit in all the trades.
I have opened BUY trade of different assets because, at the time when I was opening the trade, the market was taking support at the 4H trading chart on tradingview and also there was confirm signals on CCI and MACD indicator on the 1H chart as shown in above screenshots.
I am showing the profit trades of FXCM closed trade history.=> 1111.6-0 = USD 1111.6
Initial Portfolio- $20000
Final Portfolio- $21111.6
%P/L= +5.558%

For trade management, I put stop-loss at the point 15% below the open trade point. But fortunately, it didn't hit in any of the trades. I also applied Take profit at small resistance at 1H candlestick chart because there was a chance of reversal from this point. Some trades like BCH/USD and XLM/USD have been closed manually at a very small profit because CCI had crossed the +100 level and the blue line of MACD was about to cross the yellow line downwards.
So, sometimes saving capital becomes more important than making a profit.
This was a great experience using the CCI for trading. The lecture of my professor @asaj was so simple and understandable that I enjoyed learning this lesson. The best part of this homework was practical approach to trading. Learning lessons and taking a live trade is the best way of learning by doing.
I will use this indicator in my future trade also.
Last but not least, thanks for this wonderful lecture.

.jpg)

Introduction
With this hope that I will be successful in explaining all the tasks that may help another reader also learn this basic strategy, I am starting to write it pointwise as asked.

Question 1.
Open a demo account on any trading broker and select five cryptocurrency pairs.
I am trading since the year 2017 and am little aware of the technical analysis of the market. I have used MT4, MT5 but this time I will use FXCM to learn something new.
Now I will open a demo account on the FXCM using the link. On clicking this link, we will be redirected to the FXCM website and there we will find TRY FREE DEMO.
Simply put Email and select country and then we will receive an email with LOGIN ID and Password.

We can also download free software for PC which is available on the website. It gives an easy user experience.
After downloading, put LOGIN ID and Password and sign in.

After LOGIN, we will see the default view. Here we get the free balance of $20000 in the demo account for learning the trade and making the strategies.
In the default view, the EUR/USD currency pair is open but we can choose different assets like stocks, commodities, cryptocurrencies and also FOREX pairs.
On the left side of the window, we can see the Tools where different indicators, zoom in, zoom out, draw line etc can be used.
On achieving the expertness we can upgrade our account to Real Account by clicking UPGRADE NOW.
More interestingly, we get an option to Quick Buy/Quick sell.

On the right side of the window, we get an option to search assets.

Here, I have selected 5 different cryptocurrencies as asked in the question.
I have selected Top cryptocurrencies which is BTC/USD, LTC/USD, XLM/USD, ETH/USD and BCH/USD.
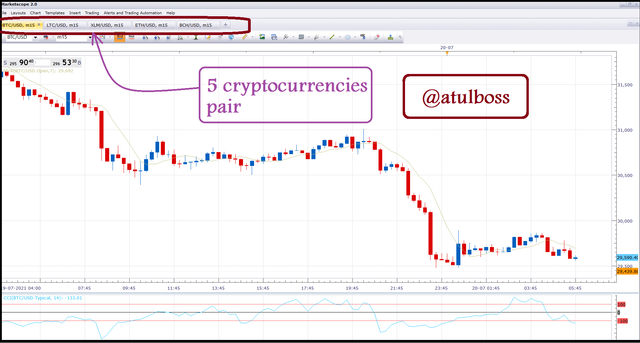
All the selected cryptocurrencies pairs are displayed above side of the chart.

Question 2.
Create a market entry and exit strategy.
Now in this part of the task, I will discuss the trading strategy which I am going to follow.
Here to trace and enter the market, we will follow three signals,
a. Analyse the trend.
As taught by my professor @asaj, when the uptrend crosses the downtrend, this will be the point of entering into the trade. On reversal, when the downtrend crosses the uptrend, this will be the point of exit from the trade.
b. Analyse the CCI Indicator (for signal).
In the CCI indicator, I will consider -100 or below as the point to enter the trade because it is an oversold zone and +100 or above as the point to exit from the trade because it is an overbought zone.
c. Follow the MACD Indicator (for signal confirmation).
I will use MACD to confirm the entry because sometimes CCI may give false signals. Not any indicators are 100% perfect but if we use 2-3 indicators for signal confirmation, we get maximum accuracy in trading.
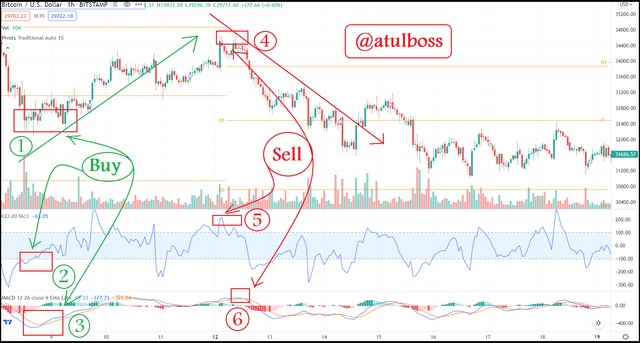
Here in screenshot, mentioned point 1 is perfect for deciding ENTRY and it is supported by Point 2(CCI) and point 3(MACD) whereas point 4 is perfect for deciding EXIT and it is supported by Point 5(CCI) and Point 6.(MACD)

Qustion 3.
Use the signals of the Commodity Channel Index (CCI) to buy and sell the coins you have selected.
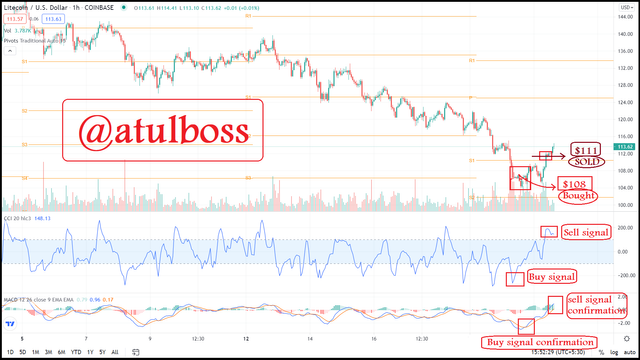
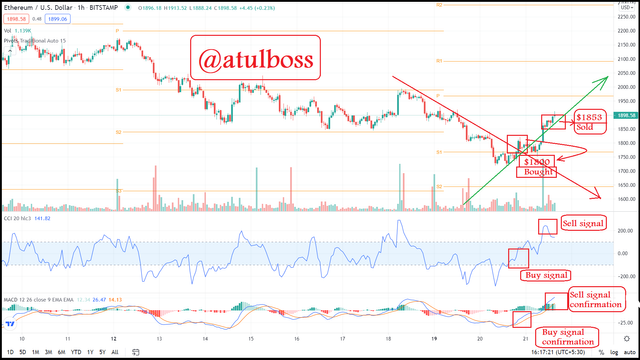
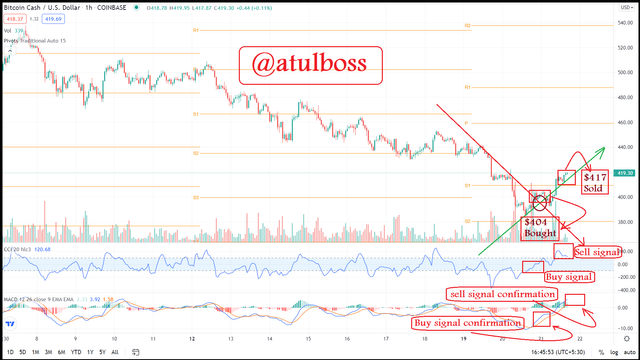
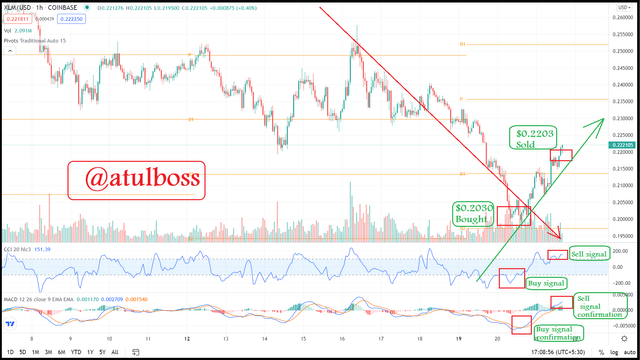
The below screenshot shows, I have made an entry with 1 lot of available demo balance in all of the cryptocurrencies chosen. Also, I have used the same strategy which I have discussed in Question 2.


Qustion 4.
Declare your profit or loss.
I have opened 5 trades using the same strategy and fortunately, I got the profit in all the trades.
I have opened BUY trade of different assets because, at the time when I was opening the trade, the market was taking support at the 4H trading chart on tradingview and also there was confirm signals on CCI and MACD indicator on the 1H chart as shown in above screenshots.
I am showing the profit trades of FXCM closed trade history.

Profits:
BTC/USD- $746.90
LTC/USD- $283
ETH/USD-$52.80
BCH/USD- $11.60
XLM/USD- $17.30
Total= USD 1111.6
Loss: zero
Net Profit made=Total Profit-Total Loss
Initial Portfolio- $20000
Final Portfolio- $21111.6
%P/L= +5.558%

Qustion 5. Explain your trade management technique
For trade management, I put stop-loss at the point 15% below the open trade point. But fortunately, it didn't hit in any of the trades. I also applied Take profit at small resistance at 1H candlestick chart because there was a chance of reversal from this point. Some trades like BCH/USD and XLM/USD have been closed manually at a very small profit because CCI had crossed the +100 level and the blue line of MACD was about to cross the yellow line downwards.
So, sometimes saving capital becomes more important than making a profit.

Conclusion
This was a great experience using the CCI for trading. The lecture of my professor @asaj was so simple and understandable that I enjoyed learning this lesson. The best part of this homework was practical approach to trading. Learning lessons and taking a live trade is the best way of learning by doing.
I will use this indicator in my future trade also.
Last but not least, thanks for this wonderful lecture.

Superb performance @atulboss!
Thanks for performing the above task in the fourth week of Steemit Crypto Academy Season 3. The time and effort put into this work is appreciated. Hence, you have scored 9 out of 10. Here are the details:
Remarks:
Atul Pathak, your work exudes remarkable mastery of the commodity channel index (CCI) signals. Combining a momentum-based indicator with a trend-based indicator often gives some of the best signals. The combination of CCI and MACD is a good example of this.
Personally, I would have added a volume-based indicator to the mix. Advance/Decline line (A/D) is my go-to. Despite the A/D line isn't as price sensitive as the CCI and MACD, it gives us an idea of the total unit of crypto that is participating in an uptrend or downtrend.
Anyway, your work could use a little bit of more explanation. Although the screenshots you provided were self-explanatory, it may be challenging for some to understand it. So as a suggestion, give a brief explanation under each graph next time.
We hope to see more from you in the coming weeks.
Thanks for evaluating my work. Dear sir, I will try to explain my content in more detail from the next homework.