Candlestick Patterns - Steemit Crypto Academy Season 5 - Homework Post for Task 10
Hello guys,
Finally, I have come to the final task of the fixed introductory courses, it tries to enlighten us on the Japanese candlesticks. Candlesticks are patterns which represent price movements and each candlestick represent price movement for an asset within a certain time frame. Candlesticks forms the fundamentals for technical analysis, because it helps in identifying price trend, value areas and entry triggers when it comes to trading. Candlesticks are made of different types and forms, and after reading the lecture article, I have solved and presented my assignment on the questions given below.
Question 1
1a) Explain the Japanese candlestick chart? (Original screenshot required).
b) In your own words, explain why the Japanese Candlestick chart is the most used in the financial market.
c) Describe a bullish and a bearish candle. Also, explain its anatomy. (Original screenshot required)
Solutions
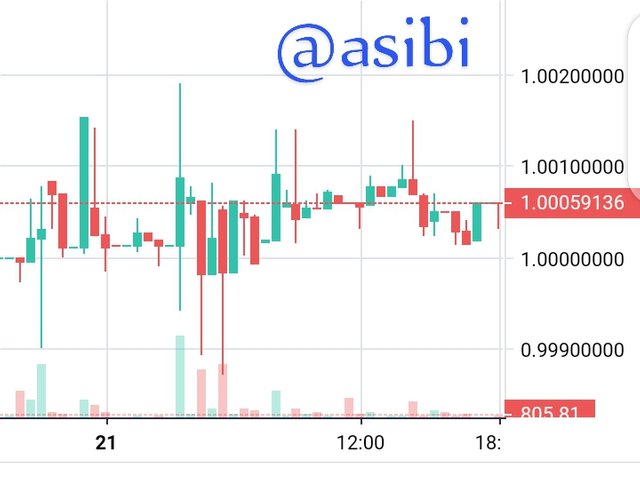
The trading view of my poloniex account showing Japanese candlesticks patterns from my poloniex trading view
The Japanese candlesticks patterns are simply procedures of reading price charts and history stated that it was originated from Japan, the candle stick pattern is made up of four sections or components, these are, high, low, open and close prices at different time periods. The various components occur as a result of the activities between buyers and sellers, buyers create what is called a bullish candlestick pattern which is commonly green in colour but can be changed base on the trader's trading view style, and it also shows an up ward price movement.
Sellers on the other hand create the bearish candlestick patterns, it normally has a red colour showing fall in price of a particular asset. On every trading view, either on the crypto market or the shares exchanges, one will always come across these candlesticks patterns, on the trading view, each pattern represent the Price changes of an asset within a certain time frame, ranging from 5 minutes, a day, months up to 1 year and even more.
At the end of each trading session, there are some deduction you can make from the price movement of an asset just by looking at the pattern a candle stick moved. The open price which is the starting price of an asset, the closing price is the last price of the asset, the high price is the highest price reached by the asset but faced a higher price rejection and finally low price is the lowest price reached by the asset but faced lower price rejection. Because of the opposite movement of the bullish and bearish candlesticks, their open prices are opposite to each other, the real price part of a candle stick makes up the body which tells you who is in control of prices and the shadow price makes the wick which tells you the type of price rejection, these components can form various types of candlesticks patterns which include, engulfing patterns, hammer and shooting star, Dojis (dragon and gravestone ), tweezer bottom and top, morning and evening star etc.
Apart from the fact that it might be the oldest trading tool that have ever existed, making it very known and grounded when it comes to the financial markets, I think it forms the fundamental, foundation and the bed rock of trading and making a good trade in terms of identifying price trend, area of value and entering trigger points. Though we always say that candlesticks can not be used for trading in isolation and should be used with other indicators, but without candlesticks, all the other indicators will become useless. We can't use, RSI, support and resistance levels, Elliot waves, Bollinger bands, oscillators etc in our everyday trading without candlesticks patterns So in short, candlesticks patterns form the foundation for technical analysis in the financial markets hence the most used in the financial markets.
Source
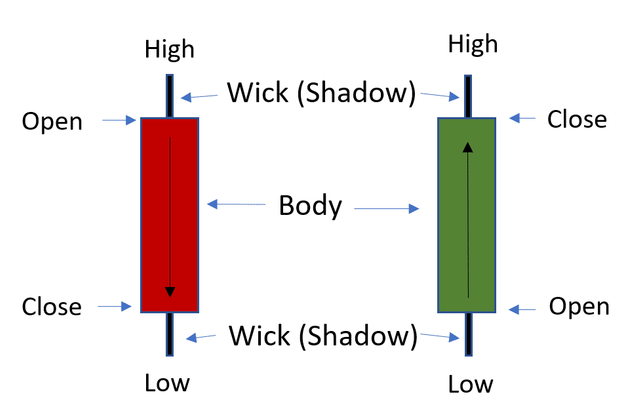
From the above explanations, I made mention of a bullish and a bearish candlesticks patterns, now let's look in to details what they really are in terms of their architectures and representation. In the financial market, there are basically two groups of people, those who buy technically known as taking long position and those who sell technically known as taking short position, and as these activities are taking place in the market, it creates two types of candlesticks, which are the bullish or buying candles and the bearish or selling candles
- A bullish Candle: The bullish candles are mostly green in colour and they represent long positions showing an upward price movement or trend. The market is generally seen as a bullish market when the number of bullish candles out numbers the sellers causing the price movement to go upward generally causing an up trend. The bullish candles are made of two components, that is, the body and the wick. These components are as a result of demand and supply, open price, closing price, highs and lows, the body is between the open and close prices, the wick is between the close price and the highs or the lows. With the bullish candles, the open price starts from the bottom and each candle represent a time frame as seen above.
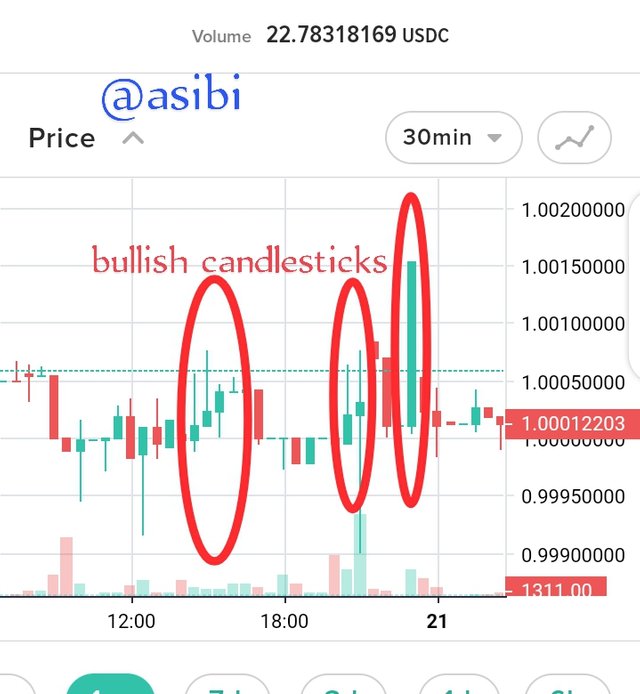
A sample of a bullish candlestick pattern from poloniex trading view
- Bearish Candles: The bearish candlestick is the opposite of the bullish, it represents the number of short positions taking place in the market. Normally it has color red indicating a decrease in price of an asset, the market is seen as a bearish market if the bearish candlesticks out numbers the buyers causing a general down ward market trend. Just like the bullish candles, when it comes to the architecture of the bearish candles, we have the body and the wicks cause by price movement within a certain time frame. But the opening price of the bearish candles start from the top and decrease down ward and it also represent a time frame as seen above.
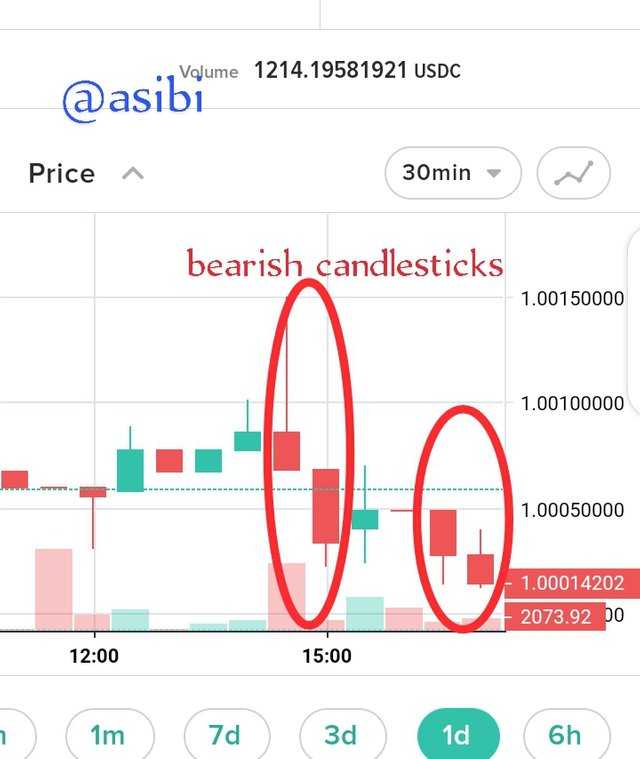
A sample of a bearish candlesticks patterns from poloniex trading view.
Conclusion
In both cases of the bullish and the bearish candles, a trader can use them to make a good technical analysis and identify entering and exit points on the market. But remember that candlesticks patterns gives a very good results when used with other indicators like support and resistance levels, MA, RSI etc. With good trading style, you can always maximize your trade but you can loss everything with the bad style, so let's be circumspect when using these indicators for technical analysis.
Thank you professor @reminiscence01 for this wonderful class, I have really learnt a lot and a big thank you to all the professors for these introductory courses, it has really prepared me for the bigger tasks ahead.
Cc: @dilchamo
Thank you
Sort: Trending
Loading...