Steemit Crypto Academy Season 4 Week 2 - Homework Task for @reminiscence01 | Technical Indicators
 Image Created by me using canva

Hello everyone, I hope you're all doing fine. The same goes for me.
In this post, I'll be posting a homework task for crypto professor @reminiscence01
As you can get from the title of this post, it will be based on Technical indicators, which is crucial and elementary for a trader to know. We'll talk about what these indicators are and what are their properties or characteristics. We'll see some of the examples of commonly used indicators and see how to modify them.
I'll explain these Technical indicators, their uses and examples, and many other sources using fully referenced and markdown images from various sources present on the internet. In any case of problems and issues, you can also reach out to me in the comment section.
(a) In your own words, explain Technical indicators and why it is a good technical analysis tool.
These are the mathematical calculations extracted from former trend movements; it helps a trader predict price movements in the crypto market. Their mode of representation is graphical, and hence, one can get an idea about how the market trend moved from previous times. Analysing these old data and making calculations based on them helps predict the future market trend, which helps traders make buying or selling decisions.
We can simply apply these indicators on the price charts, and they'll graphically show the results on that chart using which a trend movement prediction could be made.
Technical indicators use the previously formed data on price movements or trend movements to predict future trends by deducing mathematical expressions and applying them to new forming trends. These use statistical trends extracted from trading patterns and activities of the traders after certain price movements and volume changes.
The working approach of these technical indicators, which are used in technical analysis, is very different from fundamental analysis tools, As fundamental analysis is based on the innate value of the asset and its economy and financial data. Rather, technical indicators use trend movements, trading patterns and some other tools also to predict the future trend.
There are countless examples of these indicators. Some common indicators are:
RSI
MACD
ADX
Ichimoku cloud
volume
CCI
Bollinger band and many more
NOTE: It is very important to know that these technical indicators do not give any Assurity to buy or sell any crypto asset. Also, they do not assure any certain price movement as the crypto market is highly volatile in nature and solely based on buyers and sellers volumes and trading patterns. However, they may help predict the movement of a trend to a certain extent.
Technical indicators are of three types :
Trend Based Indicators
Volatility Based Indicators
Momentum-Based Indicators
I'll explain these types of technical indicators in detail later in this post.
(b) Are technical indicators good for cryptocurrency analysis? Explain your answer.
Yes, these technical indicators are very important and necessary for technical analysis. By using these indicators, an investor can predict the market movement and make buying or selling decisions. But, as I've mentioned above, these indicators are not that accurate as the crypto market does not depend on previous data but real-time investment, buying, and selling. It only depends on present transactions and the volume of the assets. Previous data just shows that the price or trend is moving in patterns, and one can predict their movements by analysing those patterns.
That's why I suggest that a trader shouldn't rely too much on these indicators. Yes, they provide critical info. But that's not enough for making an investment. Standalone, these indicators are not relevant to make trading decisions.
To minimise risk factors, one can perform fundamental and technical analysis on the asset they want to invest in and then use these indicators alongside the analysis and different tools. Also, one can use more than one indicator and analytics to the same asset chart, which will help make a clear understanding and make predictions more accurate. Hence, minimising loss. Multiple indicators may show multiple values, but that makes you more aware and unravel more perspectives for the investment.
These indicators are used for short term investment or trading(i.e. buying or selling)as they're designed to show more accurate values and predictions when using on short term trade movements. As for the long term, users can identify the Entry and Exit points in the market as these indicators can predict price drops and lifts in the short term. With this, they can hold an asset and wait for the value to skyrocket.
(c) Illustrate how to add indicators on the chart and also how to configure them.
For this activity, I'm using Tradingview platform, as I have a better understanding of this platform, and it is very easy to use. I'll show step by step how to add these indicators to the chart.
The Steps are as follows:
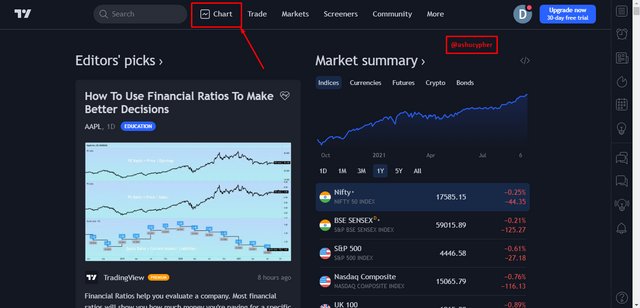
Step 1: Go to the Tradingview website and click on the Chart icon at the top left corner.
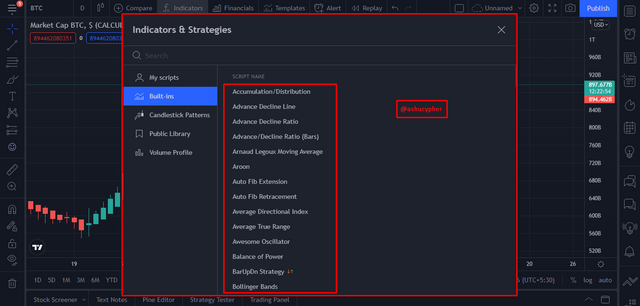
Step 2: Click on the f(x) icon. It'll open a new panel which is called indicators and Strategies. It'll show the indicators menu on the right side.
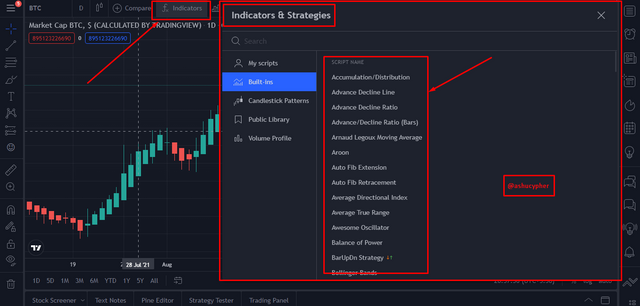
As shown in the figure below, you can search the indicator's name that you want to add. I'm applying RSI(Relative Strength Index):
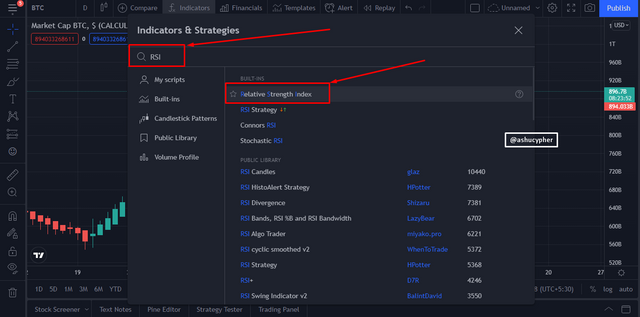
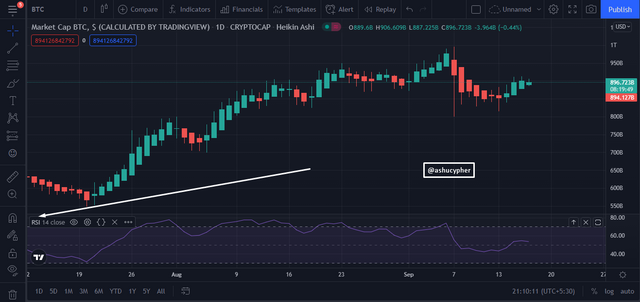
Step 3: Simply click on the selected indicator, and that indicator will be applied to the Graph.
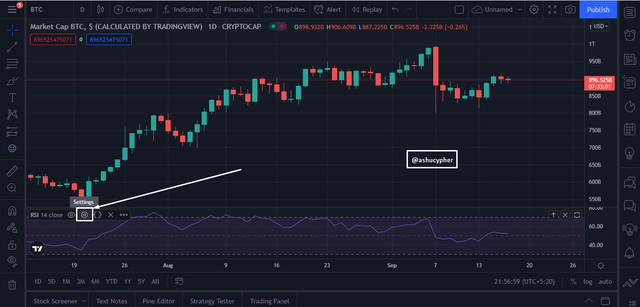
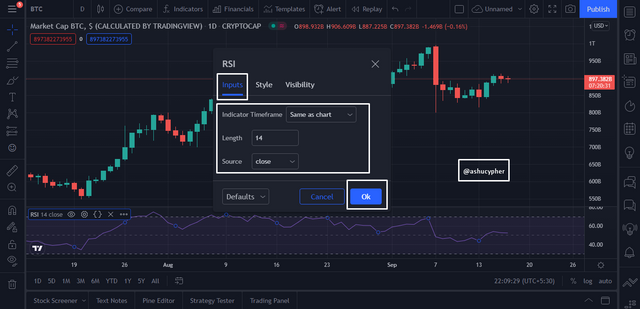
Step 1: To customise the applied indicator, you need to find the indicator bar first and then click on the settings option present on it.
After clicking on the settings icon, a menu will show up with three different categories (it may be more or less than three depending on the nature and characteristics of the indicator that you've added. in my case, it's three. namely Inputs, style and Visibility.)
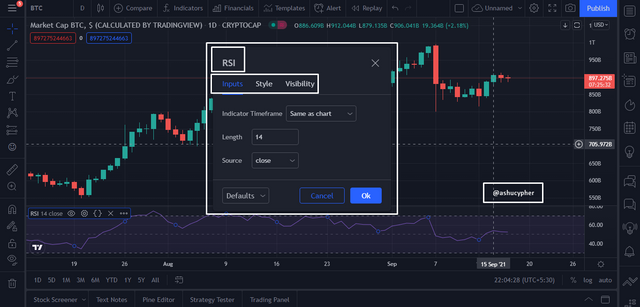
Step 2: You can change the Inputs style by altering the values present in the input menu. Length, source and time frame can be changed as from my indicator. Just change the values that you want to fill in and click OK.
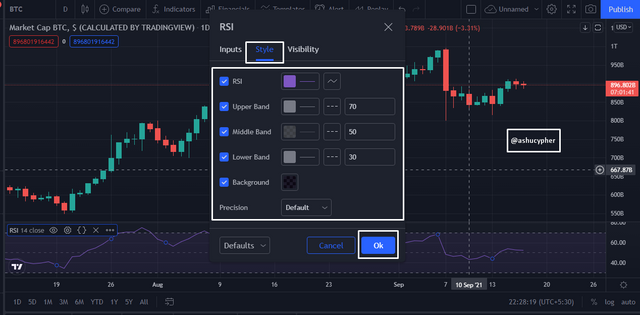
Step 3: By clicking on the style menu next to inputs, you can change the indicator styles like colours, transparency and precision.
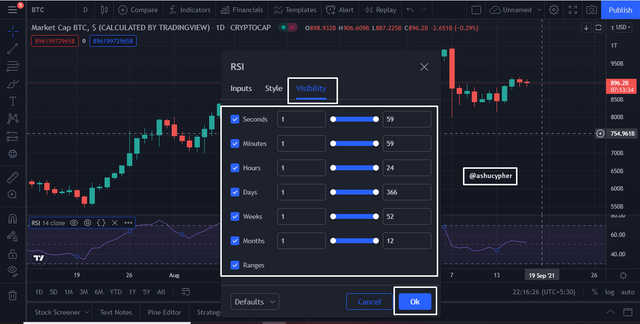
Step 4: You can click on the Visibility icon next to the Style menu and change any values you desire. This menu will change the time frame of the indicator and ranges also. Make the changes by filling in the values you desire and then click ok.
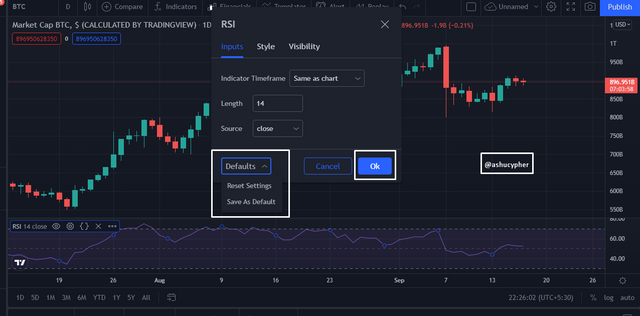
Now, you can also save your own created or modified indicator settings as defaults. So that whenever you apply that indicator, your modifications will remain applied. And in case you don't need such things, you can also go back to defaults by clicking the default icon.
(a) Explain the different categories of Technical indicators and give an example of each category. Also, show the indicators used as an example on your chart.
There are three main types of technical indicators based on the investor sectors.
Trend Based Indicators
Volatility Based Indicators
Momentum Based Indicators
These are also called "Trend following" Indicators, and as the name suggests, they follow the trend patterns. Meaning - if the price shows an uptrend, then the indicator will also show a slope increment in the graph, and the same is also true for a downtrend case. We can say They move in the same direction as price movement, and they operate in a fixed range and clearly show strong and weak trends to make good trading decisions.
Some of the examples of Trend based indicators are :
Moving Averages
TRIX indicator
price envelope
Ichimoku Kinko Hyo
Supertrend and many more.
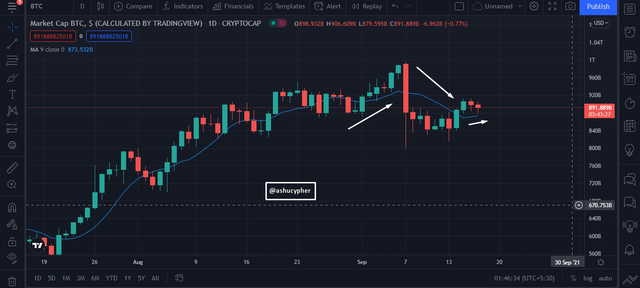
As you can see in the chart above, I've applied Moving Average Indicator, a type of trend indicator, and it is going with the direction of the trend. The blue coloured line is called the Moving Average Line, and it follows the trend patterns.
As the name suggests, the indicators which fall into this category are used to measure the volatility level of a crypto asset. Volatility shows the constant trend movement and can also be used to see sudden market price drops and uptrends. They simply show the levels of volatility, whether it is low or high. As these are graphical representations, traders can easily identify trends and enter the market when the volatility indicators show low volume with lower price and hence buy the assets. After that, they wait for the volume to grow then sell the same asset making a high exit with a high price.
Some of the examples of volatility-based indicators are :
Average True Range(ATR)
Bollinger bands
CBOE volatility index
Volatility Alert and many more.
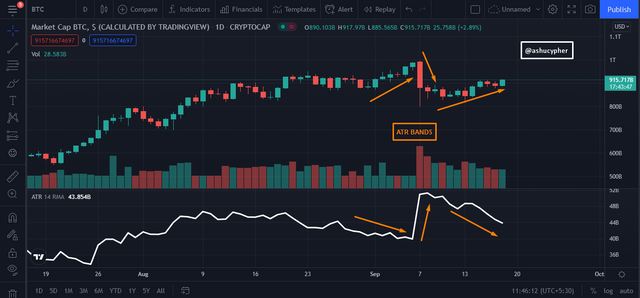
As you can see in the chart above, I've applied ATR(Average True Range) Indicator to the graph BTC/USD along with the volume. And it's clearly showing the increment and decrement in the volume and moving along with it. These volatility indicators do not show any uptrends or downtrends, and all they show is volatility. You can see in the image above that after red candles at the right side of the chart. The ATR is showing high value. That high value signifies that the volume or volatility has changed significantly. It does not show uptrends or downtrends. They can be analysed by seeing the trend movement instead.
Both sudden uptrends and downtrends show a change in volatility, so the ATR shows a high value on the right side of the indicator.
The indicators which fall into this category are also called the Oscillators. These indicators are used to identify the market strength and to analyse the price movement from a point. The Momentum based indicators operate in a range of prices. If the price crosses the ranges, then overbought and oversold happens. As the crypto market is highly volatile and the assets constantly change the price from bearish to bullish and bullish to bearish, the assets can be overpriced or can lose value and become cheap. Once an asset is overpriced, the investors start selling the assets and making profits, which creates selling pressure on the asset. In an oversold event, an investor enters the market and waits for the price to grow.
Oscillators show the overbought and oversold values of a crypto asset graphically by which a trader can make good trading decisions and make profits.
Some of the examples of these indicators are :
MACD
RSI(Relative strength index)
stochastic
Average directional movement indicator
CCI(commodity channel index) and many more.
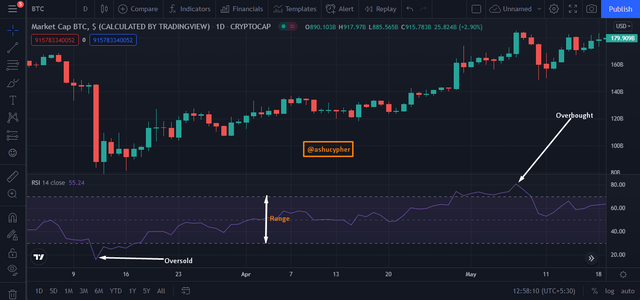
As you can see in the graph above, the price oscillates between the range, and when the price crosses the ranges at any point, it's called overbought or oversold depending on which range it crossed(i.e. Upper or lower).
(b) Briefly explain the reason why indicators are not advisable to be used as a standalone tool for technical analysis.
Indicators are very important tools and give traders an upper hand in understanding the market position and make predictions accordingly. It is true that they're very useful in that manner but, it is also true that relying only on one indicator may lead to a loss in an asset. A trader should apply many other trading concepts and analytics before making a trading decision. Using indicators standalone is not recommended. As the result of the prediction depends upon the market conditions and not on the indicator data. Indicators have previous historical trend movement records and analysis data on the volume. But that is not enough to make a trade. One should know how to properly analyse and use these indicators. To avoid loss, more than one indicator or a combination of indicators can be used. One can also use a customised indicator after conducting thorough research on the asset and its price movements.
Also, indicators provide apparent values and results, which is not relevant for technical analysis. Sometimes indicators also show errors due to inconsistency in price and trading patterns.
(c) Explain how an investor can increase the success rate of a technical indicator signal.
Selection of the best suitable indicator:
It is given that one should know what kind of indicator he should use for his trading. An investor should be well aware of his trading style and also thorough with the patterns. He should know the basics about the indicator that he's using and how to modify that indicator accordingly.
Indicator Combinations:
A trader should know how to use these indicators with other indicators and analysis tools, which can provide hard evidence and make predictions more accurate. These combinations may help traders to fetch out the false signals that are shown sometimes by these indicators.
Signal reading:
Traders should know how to read an indicator clearly and make trading decisions upon the results. It solely depends on the gut of the trader and the belief that he has in his skills. Also, it can be done by continuous use of these indicators, which may lead to a better understanding of their working patterns.
A trader should know what these technical indicators are and how to use them in the crypto market, and he should know how to modify and customise the Indicator accordingly to his needs. These indicators provide an upper hand to the traders to predict the price movement of an asset in the crypto market, which is a crucial factor in making a profit or avoiding loss.
Although they're very useful In predicting trends and patterns, one should not rely too much on these and should not make trading decisions only based on the values provided by a single Indicator. With indicators, a trader should know how to use these combinations with other indicators and analysis tools to minimise the probability of loss.
Every asset has it's high and low. A trader should be patient and then make decisions.
Being able to gather such knowledge, I am truly blessed and wanted to thank professor @reminiscence01 to deliver such an amazing task.
That'll be all from my side.
Thank you for reading
@reminiscene01
Hello @ashucypher, I’m glad you participated in the 2nd week of Season 4 of the Beginner’s class at the Steemit Crypto Academy. Your grades in this task are as follows:
My Reviews and Suggestions:
You have completed the task very well.
Your explanation in question 1.b is still too general, you should explain it more specifically about the relationship between indicators and cryptocurrencies.
The watermark you put on your screenshot is too small and hard to see, please enlarge it next time.
Some explanations are too long, please separate them into shorter paragraphs for easier reading.
There are some grammars that are still wrong, please pay attention again.
Thank you!
Thank you, professor.
Would you mind highlighting the segments where I need to improve grammatical errors?
Congratulations! Your post has been selected as a daily Steemit truffle! It is listed on rank 20 of all contributions awarded today. You can find the TOP DAILY TRUFFLE PICKS HERE.
I upvoted your contribution because to my mind your post is at least 7 SBD worth and should receive 33 votes. It's now up to the lovely Steemit community to make this come true.
I am
TrufflePig, an Artificial Intelligence Bot that helps minnows and content curators using Machine Learning. If you are curious how I select content, you can find an explanation here!Have a nice day and sincerely yours,

TrufflePig