Steemit Crypto Academy Season 3 Week 4 - Homework Task for @reminiscence01 | Candlestick Patterns

CANDLESTICK PATTERNS
These are the tools used by a trader to make good trading decisions. The trader reads the candlestick patterns and deduces his own personal psychology about the trend that will affect his trading decisions.
Nothing is absolute. Like with the candlestick patterns, there is no certainty that the trade will follow the predicted path. But it can provide a rough idea about the trade of an asset.
To minimize loss and maximize profit, traders use different tools and analytical practices before making buying and selling decisions.
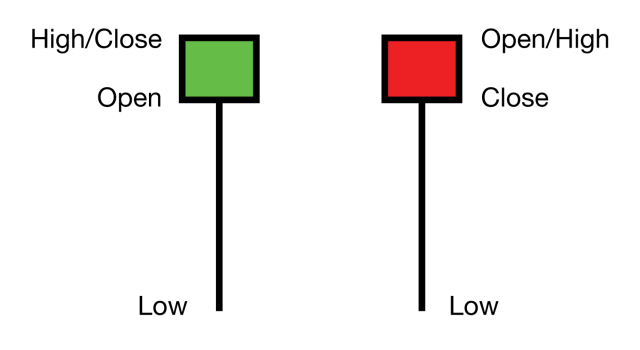
Candlesticks are easy to analyze. For ex. The large candlestick body shows the high volume and strong buying and selling pressure in price, whereas small candles show vice-versa. As the visuals are straightforward, the patterns are complicated to find and follow, but one can identify the patterns and deduce their own trading psychology with practice.

Question 1:
In your own words, explain the psychology behind the formation of the following candlestick patterns.
BULLISH ENGULFING CANDLESTICK PATTERN
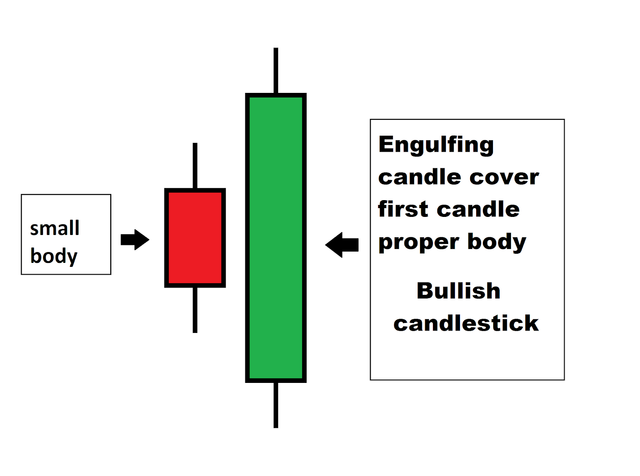
- It consists of 2 neighbour candles, the first candlestick will be red in colour, and the second candle will be green. The green candle will fully engulf or cover the previous red candlestick. The closing and opening points of these candles are in reverse order.
psychology behind formation :
- The trend indicates that a reversal will happen or occur in the price chart from bearish to bullish. As the price moves up due to higher demand than the supply, buyers become more active or dominant in affecting the market price.
DOJI CANDLESTICK PATTERN
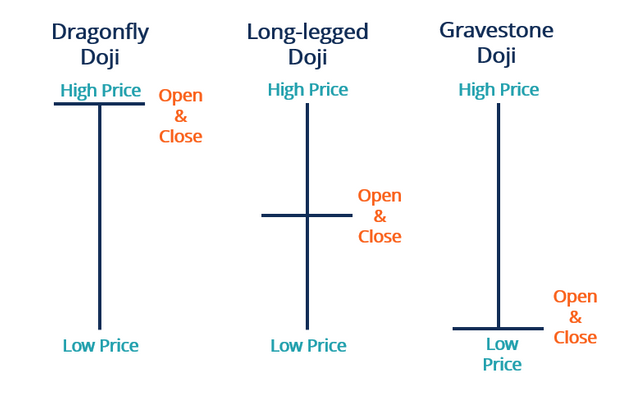
- These are thin rod or line-shaped candlesticks in which the opening and closing prices are the same.
It consists of 5 types from which 3 are major, as I mentioned below:- - Dragonfly Doji
- Long-legged Doji
- Gravestone Doji
Psychology behind formation:
The Doji indicates neutral market conditions. Both buyers and sellers are on the same ground. I.e. market will not be affected by both of these as no one from either of them is dominant, resulting in bringing the price back to the opening value. Also, the Doji pattern candlestick indicates the Indecisivenees of the market.
A buyer or a seller will make a halt condition when a Doji will occur and wait for the next trend reversal as Doji shows the weakening strength of a trend.
HAMMER CANDLESTICK PATTERN

It shows that the opening price and closing of the candlestick are almost at the same price. As the name suggests, it looks like a hammer, i.e. a small candlestick with a long wick or tail.
Also, there are inverted hammers. Their appearance can also be a strong indication of a trend reversal from bullish to bearish. Inverted hammer's has its close at a similar level with the price, and it's open at low.

Image showing Inverted Hammer Candlestick.
Psychology behind formation:
- the price will move up as the Demand is higher than the supply. The long tail shows that the sellers set the price at a downfall for a short duration of time. After that, buyers came and became dominant by closing above the open candle. Also, when it appears at support or resistance levels, a strong trend reversal is possible.
MORNING AND EVENING STAR CANDLESTICK PATTERNS
MORNING STAR

source
Candles 2,3and 4 are showing a morning star pattern. It is a formation of 3 candlesticks. The first one will be a bearish candle, the middle one will be a Doji, and the third will be a bullish engulfing candle that engulfs the previous Doji candle present in the middle of the pattern, as you can see in the image I've provided above.
Psychology behind formation:
- It shows the probability of a strong bullish trend reversal, and it gets stronger when it occurs at support levels. As the supply is greater than the demand, the sellers are more dominating and control the market price. But after certain point seller shows weakening strength and are unable to push the price at lower levels. This shows the possibility of a strong trend reversal from bearish to bullish. With the formation of 3rd candle in the pattern, buyers become more dominant and push the price to higher levels, and the demand grows greater than supply.
EVENING STAR
As of morning star, it also consists of three consecutive candlesticks. The first one will be bullish, the second will be doji, and the third is a Doji engulfing candle.
Psychology behind formation:
When it occurs, it shows a strong trend reversal from bullish to bearish, and it shows good strength when it occurs at the resistance level. As the demand Is greater than the supply, buyers are more dominant in controlling market price.
From the second candlestick, the buyers show a weakening in strength and can't push the price upward anymore. This causes a trend reversal from bullish to bearish.
From the third candlestick, sellers are dominant and control the market price.

Question 2:
Identify these candlestick patterns listed in question one on any cryptocurrency pair chart and explain how price reacted after the formation. (Screenshot your own chart for this exercise)
BULLISH ENGULFING CANDLESTICK PATTERN

Market Showing a Bullish Pattern and significant price reversal in the trend.
A burst increase in trading volume can be seen clearly. This shows the higher demand as compared to supply.
DOJI CANDLESTICK PATTERN

HAMMER CANDLESTICK PATTERN

MORNING STAR

A strong trend reversal is shown from the formation of the morning star pattern.
EVENING STAR

A strong trend reversal is shown from the formation of the evening star pattern.

Question 3:
Using a demo account, open a trade using any of the Candlestick patterns on any cryptocurrency pair. You can use a lower timeframe for this exercise. (Screenshot your own chart for this exercise),
I've used paper trading feature from the website Tradingview.

BTC/USDT
*Details of my deMo trade:
Entry point: $34000
Take profit: $36000
Stop loss: $32000*

BTC/USDT
I enter the market at $34000 due to the bullish engulfing candlestick pattern, so if my prediction hit the stop or take profit level, I will book my profit and leave the market at $36000, but in case my deMo trade was invalid, I can take the exit at stop loss level($32000)

BTC/USDT


From this class, I've gained a better knowledge of candlesticks and the trading patterns formed by them. Now I can study and predict the price a little better. And I want to thank the crypto professor @reminiscence01 to provide such useful information.
Thank you for reading.


Hello @ashucypher , I’m glad you participated in the 4th Week of the Beginner’s class at the Steemit Crypto Academy. Your grades in this task are as follows:
Observation
Why didn't you enter at the opening of the next candle after the bullish engulfing candle?
Recommendation / Feedback:
Thank you for submitting this homework task.
Just wanted to get assuring trend reversal
You have been upvoted by @sapwood, a Country Representative from INDIA. We are voting with the Steemit Community Curator @steemcurator07 account to support the newcomers coming into Steemit.
Engagement is essential to foster a sense of community. Therefore we would request our members to visit each other's post and make insightful comments.
Thank you