Recognizing Simple Patterns in Trading - Crypto Academy / S5W2 - Homework Post for @sachin08

made from canva app
Introduction
Hello friends,
I'm Ashutosh Kumar And I've put 6 beginner's introductory task inside the Steemit Crypto Academy community. And I have also participated in season 4.
As you guys know that the fifth season of steemit crypto academy is going on. And now I am going to participate in this season 5 also and hope. I can do good for you.

Ques.1.- What is your understanding about Triangles in Trading. Explain all forms of triangles in your own words. (Screenshot required)
One of the many patterns for trading is pattern triangles. This proves to be a very good trading method for business and for new commerce. It's easy and simple to understand.
As the market starts trading, a pattern is formed from the volatility perspective which we call the triangle pattern. In simple words, a shape is formed at the time of volatility inside the market, then looking at it in the form of a triangle, it is estimated that when to trade.
Mainly triangle pattern divided into three types of patterns.
- symmetrical triangle
- ascending triangle
- descending triangle
Now we will discuss about all the triangle patterns in turn, then first of all we will discuss about Symmetrical Triangle.
Ascending triangle:-
ascending triangle pattern is also known as bullish chart pattern. It is often easy to identify the triangle pattern in the bullish market. It becomes a little easier to know when to enter and when to exit the market. you can see easily in the above figure that upper line(resestance line) and lower line (support line) make a triangle together. and a breakout point is also shown in the figure. The new trendline cannot go below the old line inside the ascending triangle. Buyers cannot break the support line and make a few runs in it before taking new ground or a new trade. The one who creates the chart will find a new high because in ascending order fall would have been less.
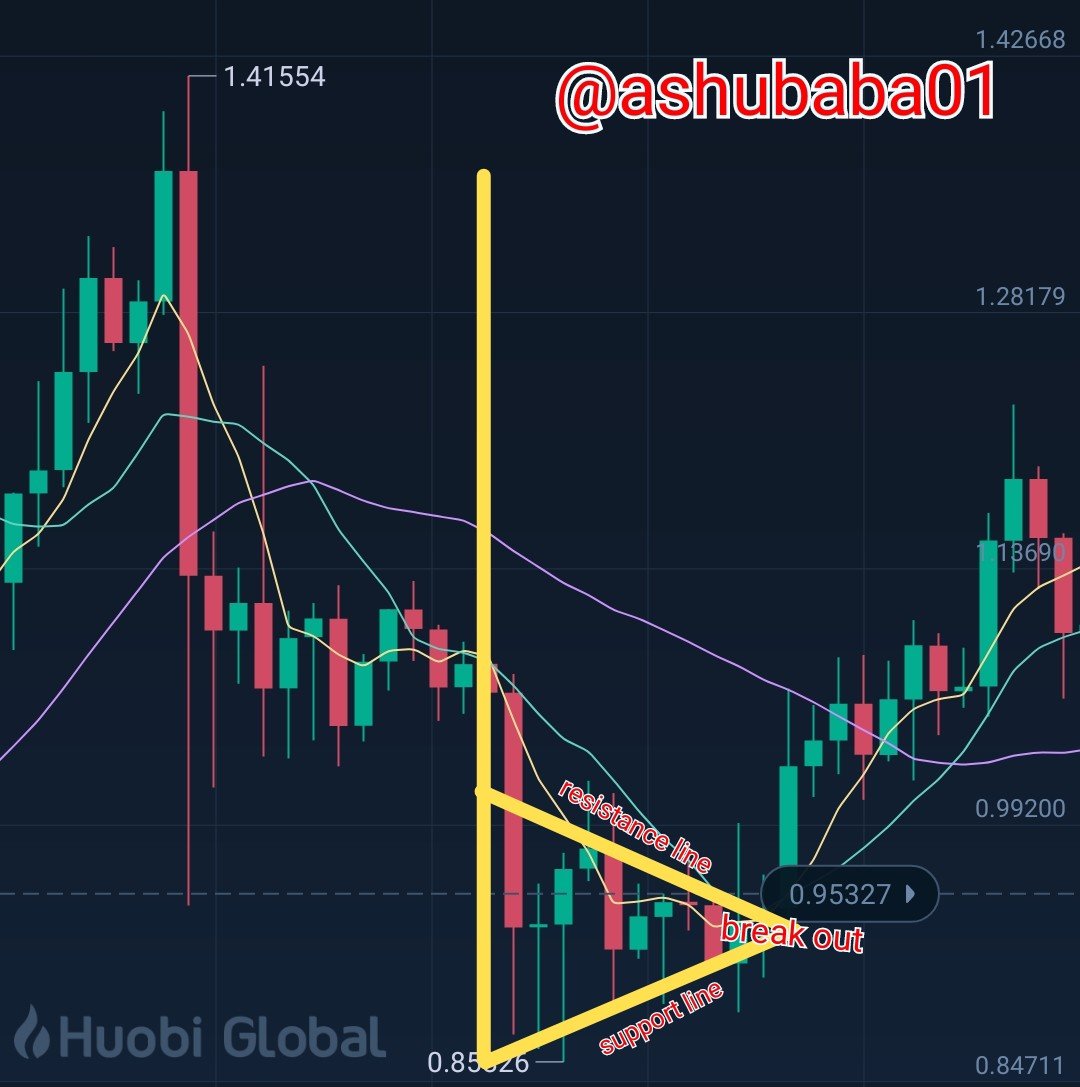
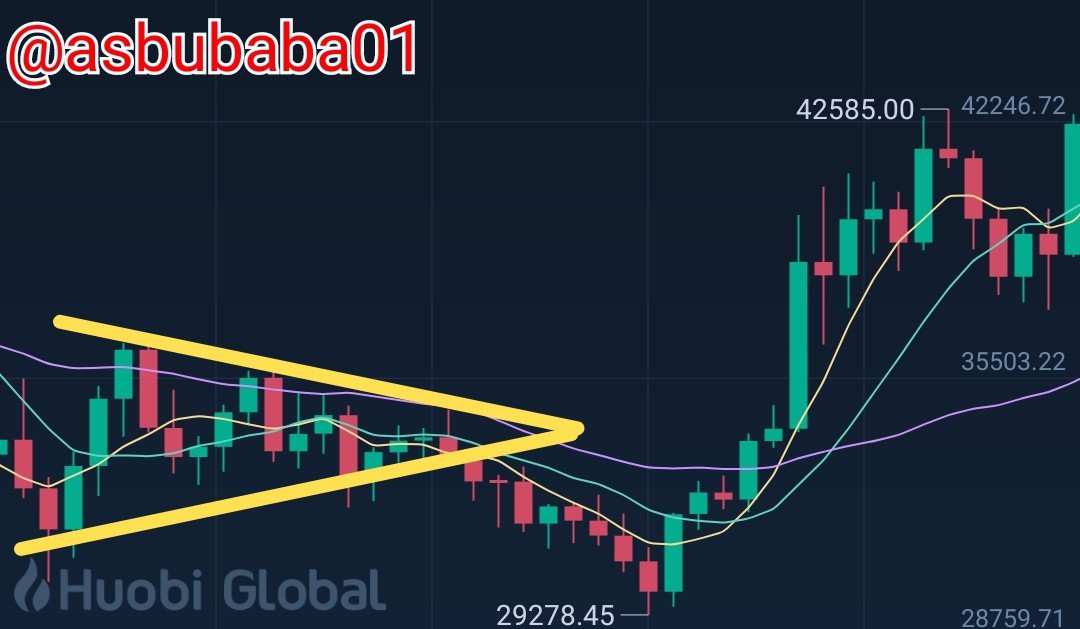
A descending triangle is often referred to as a downtrend. and it often provides a bearish signal. As you can see in the above picture, descending triangles are exactly the opposite of ascending triangles. The lines keep falling under the descending triangle and are not able to count back and return their height as before. The evolution of a descending triangle takes the same amount of time as an ascending triangle. And its volume plays a very important role when it comes to breaking out. As we have seen above there are two triangle patterns inside one descending and one ascending, that in one trade lines move up and in one the trade lines go down. Thus, it can be said that the symmetric triangle can have both of these properties. Because the probability of the lines going up and down inside the symmetric triangle pattern is 50%. we have a screenshot above, in that we can show that the market is moving. In this situation both high point and low point come together so it becomes difficult to know or identify when to invest and when not. Ques.2.- Can we also use some Indicators along with it Triangle Patterns? Explain with Screenshots. Technical indicators are a good tool used by technical analysts for technical analysis and technical strategies within trading. Technical indicators are used to make better trades and to confirm signals. As everyone knows that any start g hundred percent is not going to work. That's why we need to use two-three or more indicators inside trading. As seen in the chart above. In this chart, we have used both the William %R and this indicator. In this chart, the William %R has been unable to signal an entry whereas the indicator in this has given a signal to enter. And sometimes in some cases both the indicators indicate the entry. Ques.3.- Explain Flags in Trading in your own words and provide screenshots of both Bull Flag and Bear Flag. Flag strategy is a unique state in trading strategies and it is very important. The black pattern starts with the price movement, Be it Bear Moment or Bullish Movement. A strong gain or a strong price hike is followed by a triangle-like pattern called a flag pattern. The full flag inside the train is formed after a strong trend profit trend. The branches of a strong police friend erect a pillar of flag. After reaching the high, a triangle will be formed with the rods which forms the shape of the bull flag. To trade with black, we need to note that the two lines that are associating the looking triangle support the resistance level. When the line crosses the resistance level, then we enter the market and When this line breaks the support line and goes down or decreases, then we end our trade. They send their assets and end the business.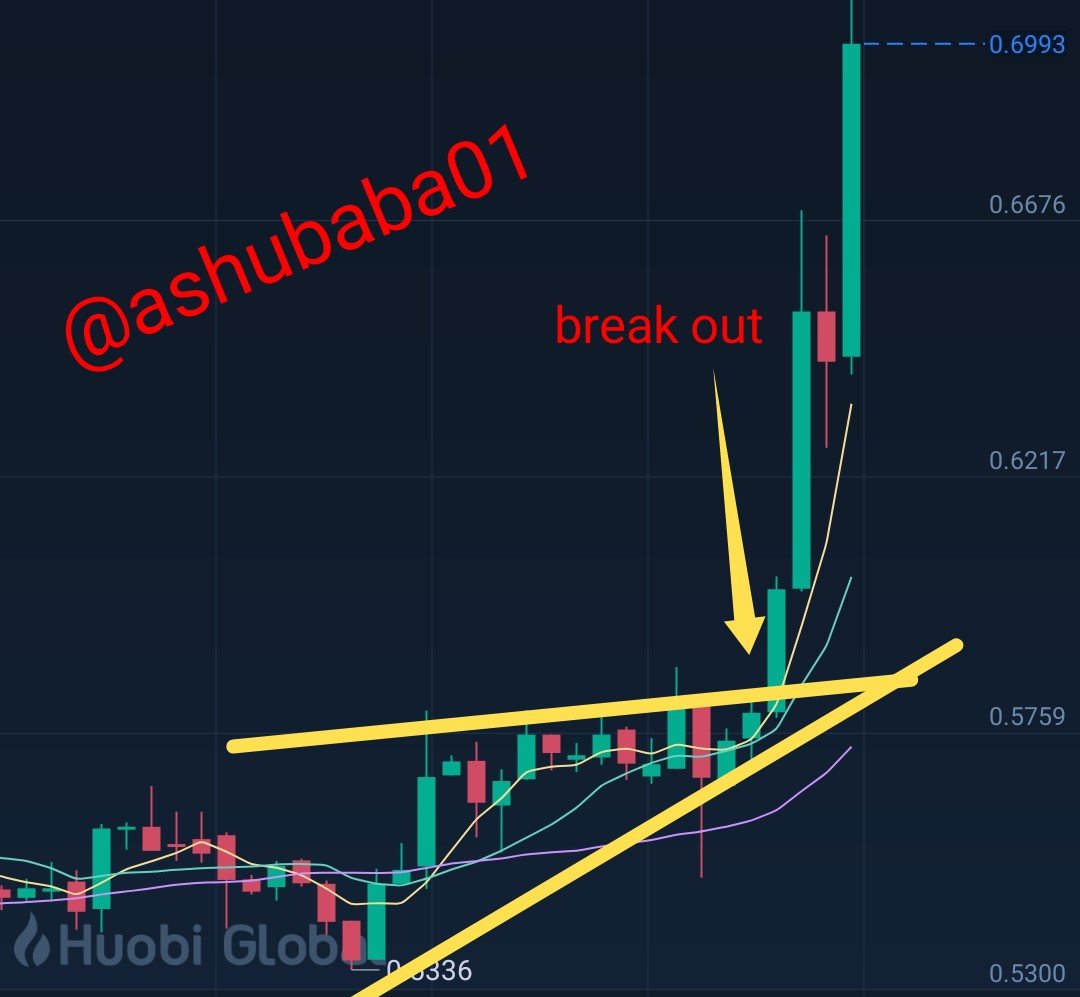
screenshot taken from huobi global app
Descending Triangle:-

Symmetrical triangle:-

screenshot taken from huobi global app

screenshot from huobi global app

screenshot from huobi global app
Here on the other hand the beer flag works quite differently from the flag. when a trade is suddenly bearish or when the graph is falling, a triangle pattern is formed by the poles, it creates a pattern of inverted flank which we call the bear flag.
screenshot from huobi global app
To trade with the bear flag, one has to pay attention to the two lines that associate the triangle and indicate the resistance and the support level. When the price crosses the line of resistance level then we enter the trade and when the price crosses the support level then we equalize our trade by selling it.
Ques.4.- Show a full trade setup using these Patterns on any Cryptocurrency chart. (Ascending Triangle, Symmetrical Triangle, Bear Flag)
Ascending Triangle:-

screenshot from huobi global app
As we can see in the above image that the pattern made in the image is simply ascending triangle. So, first we should check the registance line and support line. We should wait for the breaking for enter in the market and we can take profit level and stop loss level. Make sure to mark the stop loss just below the support.
Symmetrical Triangle:-
screenshot from huobi global app
As seen in the above image the pattern is becoming in a symmetrical angle. Where meet the resistance line and support line, then there will be our entry point and break break out point. As you know there is 50% chance of profit in symmetrical triangle pattern. Before entering, set the stoploss exactly to the support line.
Bear Flag:-

The bearish flag pattern is the exact opposite of the bullish flag pattern. As you can see it is becoming a bearish flag in the picture shown. In this type of flag, the value drops very fast and stays down for a short period of time. If we want to enter in such a way, then we should stop for a while and enter. And by hitting below the support line, the stoploss should be taken carefully.
Conclusion
According to the size, many types of patterns are made here. We have learned and read and understood about two types of patterns here, whose names are triangle and flag pattern. We also learned here that the flat pattern and the triangle are part of the pattern as well.
And each pattern works in its own way, it has its own value. Symmetrical Pattern Colon So there is 50-50 chance of profit and loss in it. That's why we should always trade carefully and read the patterns carefully.
Professor Sachin has explained very well. In my own words and I have written my task here in my own words. I hope you enjoy it.
Cc:-
Professor: @sachin08
Author: @ashubaba01