Steemit Crypto Academy Contest / S20W3: Trading Steem with Fractals and Multi-Timeframe Strategies
Hello, everyone; I hope you all are doing well. I am here to share my participation in Steemit Engagement Challenge season 20, week 3, in Steemit Crypto Academy. This week's topic is a bit difficult for me, but I try to share the knowledge that I collected after reading the contest post, participation & own knowledge.
This is a recurring pattern in the market by technical analysis to identify the trends. So there are certain charts that we can see to identify the pattern. The purpose of using this technical analysis regime is:
- Setting the buy and sell signal appropriate timing
- Knowing support and resistance
- And most importantly predictions about future values
As I always try to focus and a single regime is not successful in all the time you must know other market values as well to increase the effectiveness of any platform. So when for technical analysis we identify the reversal pattern by analysing different kinds of charge so how we can indicate the trend values
- Fractals can be used on Fibonacci this will help in getting and identifying the reversal patterns
- Something is called divergent this will help to get the price of other indicators to see the trend values
- Most importantly, on time, we get the reversal trends with approximate prices.
- Elliott Wave is also being used to see the trend reversals on time.
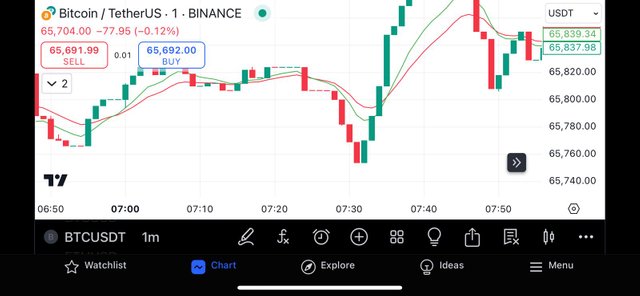
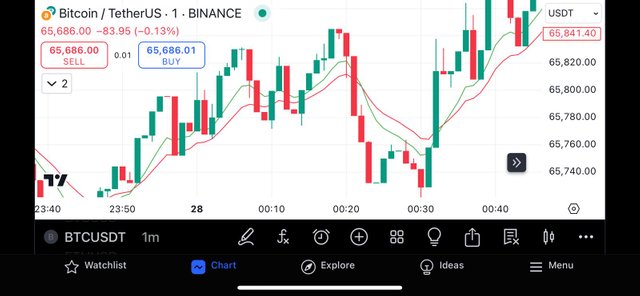
When the head and shoulder are in the reversal pattern, they are used to see the bullish Pattern, indicating that if it is smaller, then there is the prediction of potential upstroke reversal. Sometimes you have a small bearish candle which can easily be digested by a huge bullish upstroke reversal.
Bearish fractals
In this time, when both things are smaller, and this is predicting downstroke reversal, it means the Head and shoulder both are smaller, and it was the same even if you have a small bullish can be digested larger Bearish one. For bullish fractals minimum, we can choose 5 candles, and there is a position of the selection of candles from the upside to the lower side.
Now I am sharing the example by which I am using the same Steem/USDT price chart.
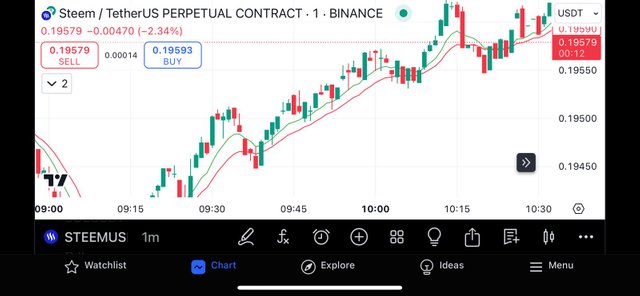
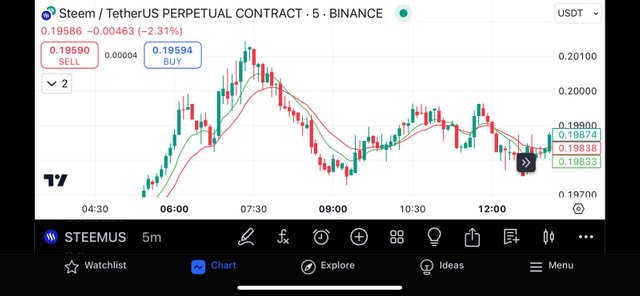
So I am trying to talk a little bit about other indicators, for example, as an indicator, and I am giving you examples with the chart. As I already mentioned so many times, no one is effective with just one indicator. To increase the effectiveness, we have to increase additional indicators to give the technical analysis of market trends.
Now these things we already know that the RSI index is from 30 and 70 and we called the RSI index if it is below 30 this is the oversold and 70 is overbought.
I have tried to mention each and everything on the graph and you can just technically see the graph you can see bullish trend and how it is made being the use of a few candles now just observe the RSI index if I talk about bullish which means RSI is approximate to 30 or it is leading towards 70 that is depiction of trend reversal. If I tell you about the bearish fractals, it means that the RSI index is approximately 70, and it is leading towards 30, and it is a depiction of a reversal pattern.
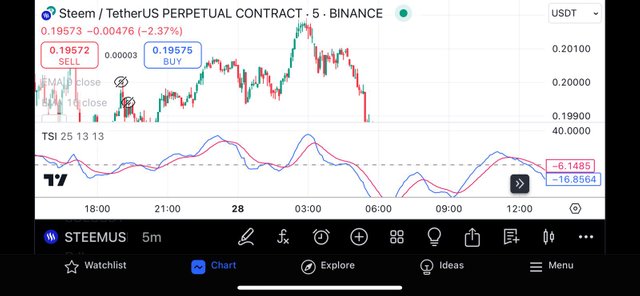
What I have explained above is the classical example of a chart that I have tried to amplify.
Now, I am trying to give the fractals practical example by the use of a chart I am using, day, one-week, and 1-hour chart and I will give extensive elaboration on that.
If we select a short period scale, this will lead to seeing very tiny changes in the reversal trend. We are not able to see an exact reversal because we are choosing a very short period to see market fluctuation, so this is just a one-hour time-scale prediction.
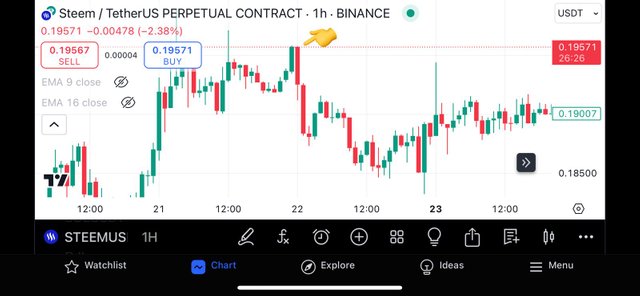
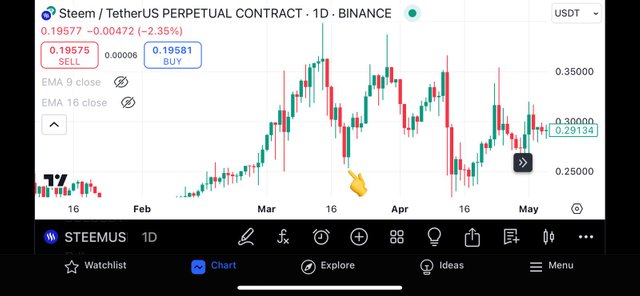
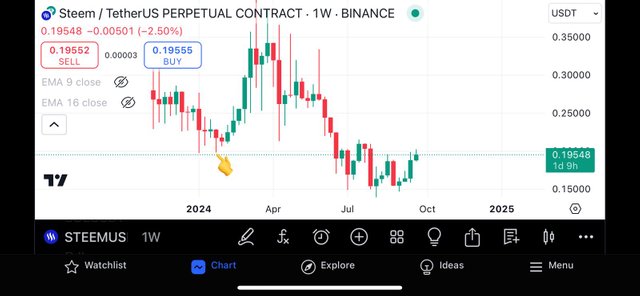
If we want to see the extensive analysis, we must choose observership for Weeks or days, so this is a very good technical analysis for the week chart, and I am using a trading view to show you guys. As I explained, the five candles form a fractal pattern, and prediction about bullish trends means market values upstroke and vice versa with bearish trends.
According to this chart, if we want to see steem token price analysis, we must keep an eye on and see deeply how the market fluctuations are going.
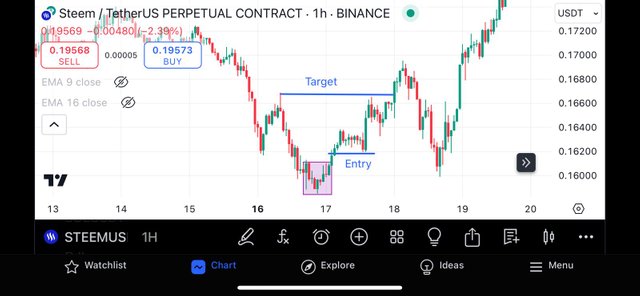
In this question I am trying to explain in detail about complete tragedy strategy using fractals for steem tokens it is pacify and tree and exit point stop loss level. I am using the Trading View website to show you this chart and I am using the buying trading for steem tokens.
The time frame I have chosen is just one hour, and I have selected Steem/USDT charting. I have tried to magnify every point on the chart so you can see clearly. I have set my target, and then I am also trying to show you guys the entry point and how we are getting the by signal approximately according to our technical analysis. How the candles are adjusting and moving. This is just according to your knowledge and how well you have an eye on buy strategy.
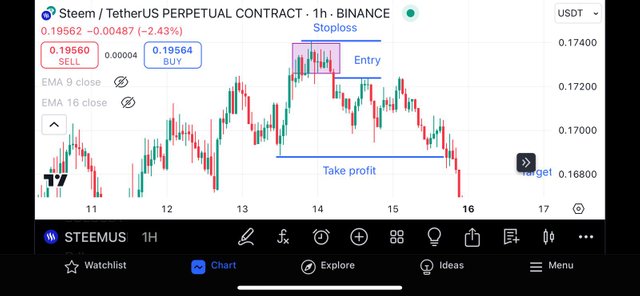
This is another graph which I am showing by the use of Steem/USDT pair charting. The time frame for this I also selected is just for 1 hour to show you how the candles are being moved and what we can predict from this.
You can see from this image when there is a bunch of candles which is being made in the middle, it is going higher and higher, meaning upstroke rather than the later one, which means that stop loss is going towards the high and middle high candles, which is a prediction to exit and we can get profit.
So the last question is about current market fractals and what do we think about the steem token is it taking bearish or bullish?
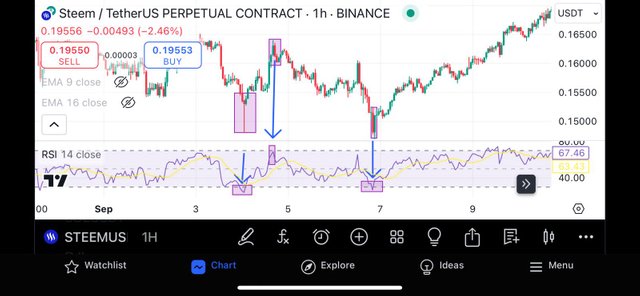
I am explaining it by using the Steem USDT chart for 1 hour. The prediction about steem is always very difficult but you know you have to keep an eye on it to see the market fluctuations and here I am just showing 1 hour graph.
Hence we have been watching since last year the condition was not very good as per the steem prices are concerned the prices are in the bullish fractals.
I am using a one-hour chart. Along with that, I have applied the RSI index to see the technical analysis of the fractals. In this chart, we can see clearly that the RSI index is predicting resistance, which means that if market fluctuation occurs, they may upstroke. And if we just talk about the steem token price it is in bullish fractals. And if we analyse the technical analysis, we may product that this will continue to stay The bullish fractals.
This was all about my participation. I would like to invite my friends @drhira, @iqrarana786, @m-fdo to share their participation. I hope you all share your valuable comments & correct my mistakes. Thank you.

Upvoted. Thank You for sending some of your rewards to @null. It will make Steem stronger.
Comment/Recommendation
Question 1: Your explanation of market fractals is well structured and relevant for identifying trend reversals. However, the charts used lack clear annotations to support your explanations. They are average in terms of visually explaining the concepts discussed. The inclusion of more technical details, such as support and resistance levels, as well as explanatory annotations, would improve the analysis.
Question 2: You have well explained the combination of fractals with other technical indicators such as RSI, moving averages, and the Alligator indicator. However, the practical examples are not sufficiently in-depth. The charts provided are also averagely annotated, which reduces their ability to clarify your points. Additional explanations on the interaction of the different indicators and more precise annotations would have made this section more effective.
Question 3: The use of fractals over different time frames is well presented, but there is a lack of clear explanation on the interaction of the identified fractals over the different time horizons. The charts you have included are not detailed enough, and the average annotations limit the clarity of key points. It would be beneficial to add more information on how fractals interact across different time frames for a more comprehensive analysis of the market.
Question 4: The fractal-based trading strategy you have developed is well thought out, but lacks detail when it comes to practical application. The charts showing entry and exit points are averagely annotated, which reduces their clarity. Additional explanations of risk management and more concrete examples would have strengthened this section.
Question 5: Your current analysis of the STEEM market is well-founded, using fractals and RSI to support your predictions. However, your charts are averagely annotated, which reduces their impact. Adding more detail on support and resistance levels and precise annotations would have allowed for a better understanding of your analysis.
Overall, you have done a good job, but it could be improved by more precise annotations on the graphs and more thorough explanations of the technical concepts. This would make your analysis clearer and more accessible to readers.
Total | 7.75/10
Thank you for your review & suggestions. I will improve next time.
Your Article is very good you have Explained market fractals Well but The charts need more explanation And annotations so That Readers can understand better. The Article can be more Effective if you clarify Support And resistance levels and Explain Technical concepts in Depth.
Overall your effort is Commendable but lacks Depth and clarity in Charts at few points. And you have Created a Great post And I wish you success
Thank you brother
allways wellcome sister