Steemit Crypto Academy Contest / S15W4 - Death Cross Vs Golden Cross
Hello everyone, I hope you all are doing well. I am here to share my participation in the Steemit Engagement Challenge season 15 week 4. This week contest for something new to me but I have a little knowledge about it. After I read about this, this was an interesting & informative topic for all of us. Because we always need to know about bull run & bear trend in the market.
1.- Explain in your own words, what is the golden crossing and what is the crossing of death. |
|---|
Golden Cross and Death Cross are the trading strategies traders use for their technical analysis. They open their trades based on results from Golden and Death Crossover.
Golden crossover.
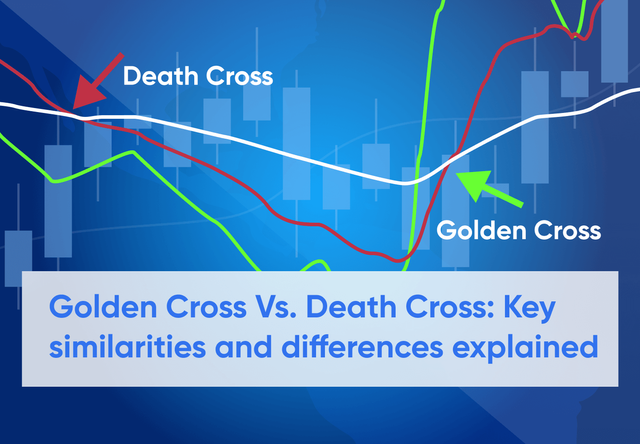
This is the perfect place for taking a long Position. As the name indicates, it's a golden time for the entry into the market. Golden crossover is made when the 50-day moving average crosses the 200-day moving average in an upward direction. The market always goes up after that crossover.
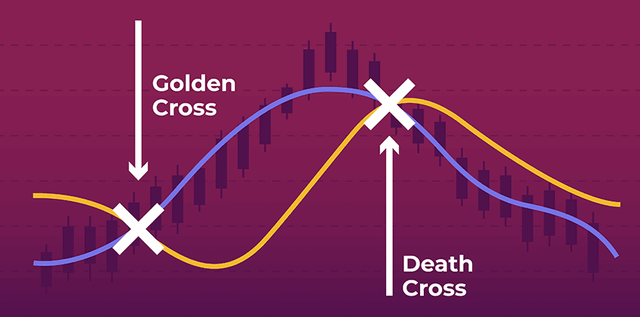
Death Crossover.
As the name indicates, it's a deadly thing for the market. The market goes for a huge dump from that point. This is quite the opposite of Golden crossover. The 50-day moving average crosses the 200-day moving average in a downward direction. It makes a selling signal in the market, the traders mostly go for short positions at that point.
2.- Use the BTC/USDT pair to show the golden crossover and the crossover of death, in the Trading view. Also, use the STEEM/USDT pair to show the golden cross and the death cross. Screenshots are required. |
|---|
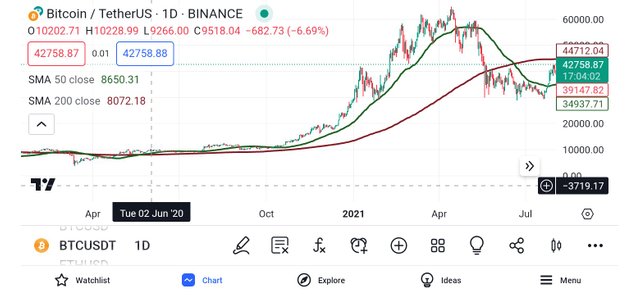
BTC/USDT Pair Golden crossover on the daily chart.
You can see the BTC Pair on the daily chart here. It's 2nd June 2020 we see a golden cross here. The 50SMA is crossing the 200SMA in an upward direction. You can see a huge rise in BTC prices after that.
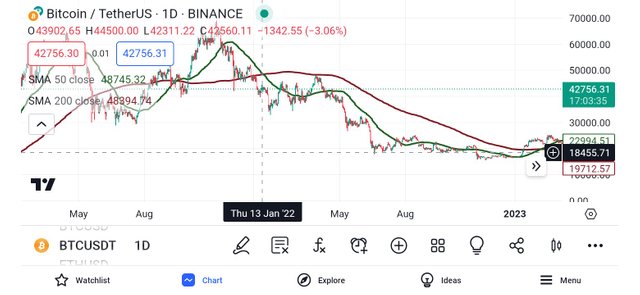
BTC/USDT Pair Death Crossover on the daily chart.
This is another chart of BTC on a one-day time frame. Here you can see a Death Crossover on 13th January 2022. The 50SMA has crossed the 200SMA in a downward direction. It is giving us a short signal here. You may see the market dump from that position.
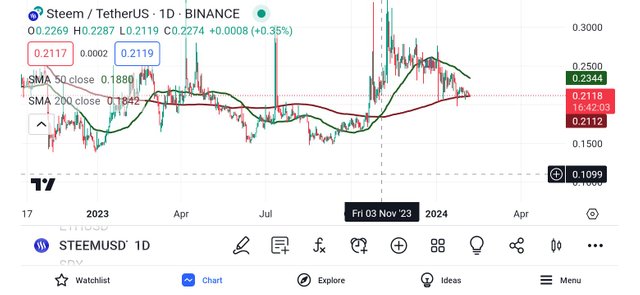
STEEM/USDT Pair Golden crossover on the daily chart.
This is the daily chart for STEEM/USDT pair on one day time frame. It's a golden crossover, you can see a rise in Steem's price. Steem is still ranging in an upward direction, the price is respecting this golden cross. We can see that 50SMA has crossed the 200SMA in an upward direction. This is the perfect time for taking a long position in Steem.
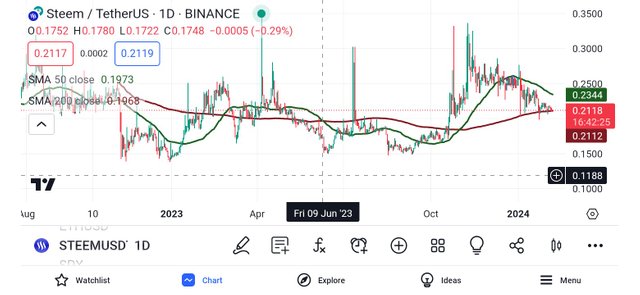
STEEM/USDT Pair Death crossover on the daily chart.
Steem chart on daily time frame. We can see a Death crossover on 9 January 2023. Steem coin took a Sharp down move from that point. The 50SMA has crossed the 200SMA in a downward direction, a short signal is created here.
3.- What is the difference between the golden crossover and the death crossover? |
|---|
| Death crossover | Golden crossover |
|---|---|
| Death Crossover is made 50 simple moving average cross the 200 simple moving average at downward direction. | Golden crossover is made when 50 simple moving average crosses the 200 simple moving average in an upward direction. |
| It's a selling signal. | It usually gives us a buying signal. |
| Bear trend is predicated Death cross | Bull run predicted by golden cross |
| The market dumped after making a death crossover. | The market goes up after making a golden crossover. |
4.- In addition to these two chartist patterns, what other indicator would you add to make the technical analysis more effective at the moment of making a decision. |
|---|
There are many other indicator that would make our technical analysis effective but I would add here 2 indicators. First one is RSI ( relative strength index) indicator which indicate both bull run & bear trend in the market.
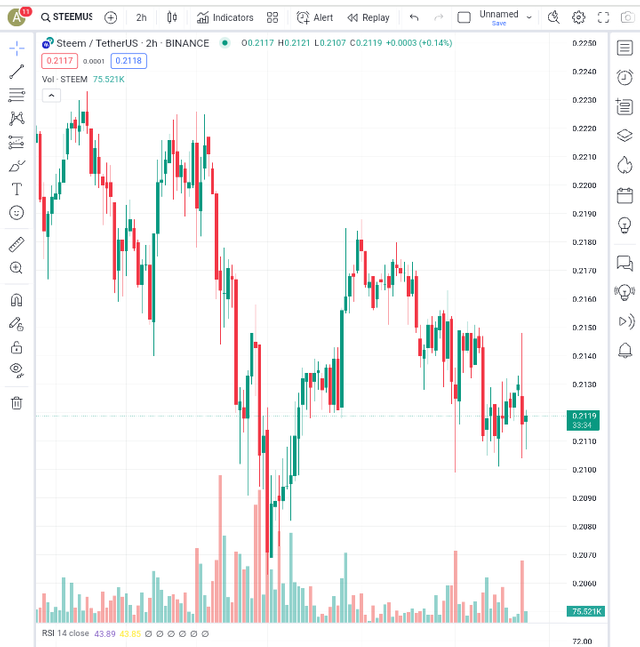
For example, if RSI indicator, indicates that there is bull run in the market then there is golden crossover & I will make entry in the market. The opposite is if RSI indicator, indicates bear trend in the market then I wouldn't make entry in the market.
The second indicator I would add for effective technical analysis in the market is parabolic SAR, which also shows the both bull run & bear trend in the market. These both indicators make effective technical analysis for better decision.
This was all about my participation. I hope you all like it & share your valuable comments. I would like to invite my friends @drhira, @sahmie, @steemdoctor1, @msharif to share their participation & review golden cross & death cross. Best of luck to all the participants
Greetings friend,
Your explanation of both the golden crossover and death crossover was fantastic. It was crystal clear and well-structured, making it easy to follow along. I really appreciated how you went into detail about each crossover, providing a thorough analysis for both the BTC/USDT and STEEM/USDT pairs. By highlighting the specific dates and subsequent market movements, you gave a comprehensive understanding of these patterns.
The comparison you made between the golden crossover and death crossover was concise and effective. It helped to clarify the key differences between the two, allowing us to differentiate their implications in the market.
It was great that you also addressed the importance of trend lines as an additional indicator for technical analysis. Considering multiple indicators, like trend lines, can enhance the accuracy of our analysis and decision-making process.
Your post was not only informative but also well-structured and I commend your efforts. Keep up the good work, and I'm sure you'll continue to excel. All the best in the contest my friend.
The explanation of Golden cross that you have provided is crystal clear and it provides a fair understanding of where to enter in the market
The comparison between the death crossover and golden crossover is effectively outlined, emphasizing the selling and buying signals along with the market trends. The clear distinction between the two increases the understanding of these chart patterns.
The trend line as an additional indicator for technical analysis is valuable. It adds a practical approach to decision-making by incorporating trends.
Good luck
Thank you, friend!


I'm @steem.history, who is steem witness.
Thank you for witnessvoting for me.
please click it!
(Go to https://steemit.com/~witnesses and type fbslo at the bottom of the page)
The weight is reduced because of the lack of Voting Power. If you vote for me as a witness, you can get my little vote.
TEAM 1
Congratulations! This post has been upvoted through steemcurator04. We support quality posts , good comments anywhere and any tags.Upvoted. Thank You for sending some of your rewards to @null. It will make Steem stronger.
My dear friend your poses always inspiration and you always use through the point keywords to make your understanding better and your question to each answer is very precise and must say you have better understanding better knowledge to answer these questions and the last question you have answered very differently and easy to understand use of language is so easy that makes it clear and the differences you have given between the golden cross and death cross make it more top notch best of luck
Saludos cordiales ashkhan, las EMA nos brindan muchas señales dependiendo de la suavidad que usemos, en este caso de los cruces necesitamos o son mas usadas las EMA 50 que representa corto plazo y una EMA 200 que representa largo plazo, estas al cruzarse nos dan señales de variación de precio y una posible nueva tendencia.
Suerte y bendiciones.
Dear Friend
It has been a pleasure reading through your post.
° you have clearly explained what death cross and golden cross is to my satisfaction. Your usage of the btc chart to explain the two chart patterns was awesome.
° you specifically mentioned 4 differences between the two chart patterns which is laudable.
° Your choice of Trendline as an indicator to be used in conjunction with golden cross and death cross is fantastic.
Overall. I read your post with great delight.
Wishing you the best in this engagement.
Hello dear, greetings to you. I hope you are enjoying the sweet moments of your life.
Golden crossover is when 50 SMA cross the 200SMA at upward position. Yes that's true. It's a sign of Uptrend or buying signal. Death Crossover is completely it's opposite and it gives us a selling signal.
You have beautifully explained the difference between Golden crossover and Death Crossover. I think too that the major difference between these two is, one is buying signal and one is selling signal. You have perfectly done the analysis of BTC and STEEM and shown us golden and Death Crossover here.
Additionally you use, RSI for your technical analysis. Yes that's the easiest one. I also prefer using it. Plus good point is that it gives us too good accuracy.
Wish you best of luck in the contest, keep blessing.