Crypto Academy Week 12: Homework Post for @koubai01 | Cryptocurrency Trading with RSI
Imagine you embark on a journey to retrieve a treasure from a place you've never been. All you were told was that the treasure is buried somewhere in Mojave desert.

The chances of finding this treasure would be painfully low because you do not have a guide or a map. In fact, embarking on that journey without a map or a guide would be insane and extremely dangerous.
Additionally, note that the chances of finding the treasure also depends on your ability to read a map if all you brought one along. Same applies to cryptocurrency.
There are several hidden treasures in the cryptocurrency market. That said, you can't just embark on a trade without having a map or being able to interpret one. The chart of a crypto asset is likened to a map. Your ability read it depends on how skillful you are in using several analytical techniques and how well you understand key indicators.
This week's task focuses on an essential indicator; Relative Strength Index (RSI). What is RSI? How does it work? How do we interpret RSI? These questions and more will answered in this post.
Relative Strength Index (RSI)
Relative Strength Index (RSI) is a technical indicator that measures the upward and downward movements of the price of an asset during a given moment of time. Since it measures price movements (or swinging in rhythm) across a given time frame, it falls within the category of indicators called the momentum indicators or oscillators.
There are two other major categories of indicators, which are known as the volume indicators and trend indicators.
J. Welles Wilder, a mechanical engineer who later became a technical analyst, developed this indicator in 1987. Four years later, he released a book called The Delta Phenomenon Or The Hidden Order in All Markets. Sadly, on the 18th of last month, he passed on.
He is regarded as the father of many indicators, including the Average True Range, Average Directional Index, Parabolic SAR and many more. He may no longer be among us, but his works live on.
How to Calculate RSI
When the Relative Strength Index (RSI) records values between 0 to 30, it means that the asset has been oversold. On the contrary, when the RSI records values between 70 to 100, it indicates that the asset have been overbought.
The formular for RSI is;
RSI = 100 - [100 / (1+RS)]
RS represents the Relative Strength Value
The formular for RS is;
RS = [(Avg. gain in a specific period) / (Avg. loss in a specific period)]
Avg. gain in a specific period represents the total of all the positive close within a particular period of time divided by the number of period.
Avg. lose in a specific period represents the total of all the negative close within a particular period of time divided by the number of period.
For example,
Avg. gain > Avg. loss = RSI > 50
When average gain is higher than average loss within a specific period, RSI will be higher than 50. Thus, if RSI rises to values within 70 and 100, it shows that the asset is being overbought.
However,
Avg. gain < Avg. loss = RSI < 50
If average gain is lesser than average loss during a particular time frame, RSI will be less than 50. Therefore, if RSI falls below 30, it shows that the asset is being oversold.
On Binance, the specific period is set at 6 by default; even so, you can increase to 14 or 24. Traditionally, it is set at 14 by default.
Can We Trust RSI on Crypto Trading? Why?
The Relative Strength Index (RSI) can assist traders to make good investment decisions. It can also help technical analysts to interpret the market. That said, it should not be used alone, because it sometimes gives false signals.
Cryptocurrency trading with RSI alone is like finding the buried treasure with latitude coordinates alone. It simply isn't enough.
Hence, it is advisable to use the Relative Strength Index (RSI) alongside other analytical techniques and indicators; such as, Parabolic SAR, MACD, and other stochastic indicators.
How to Add RSI to a Chart on Binance
Below is a guide on how to add RSI to a chart on Binance App.
Launch the Binance App
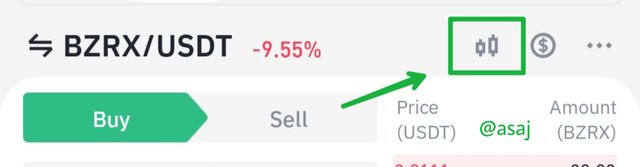
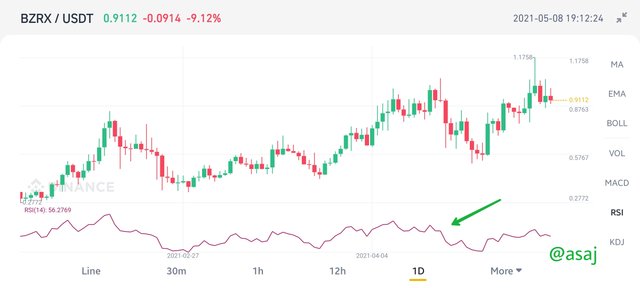
Select a trade pair. In this example, I have selected BZRX/USDT pair
Tap on the chart icon
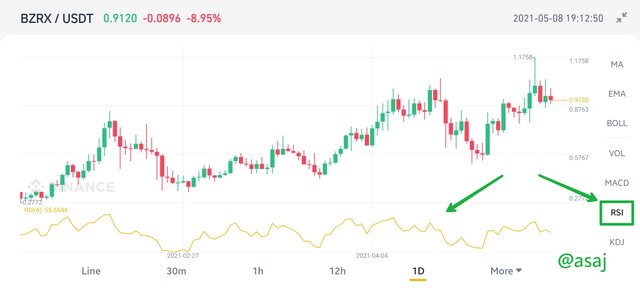
- Then press on RSI on the side of the enlarged graph to add RSI readings to the chart
How to Configure RSI on Binance
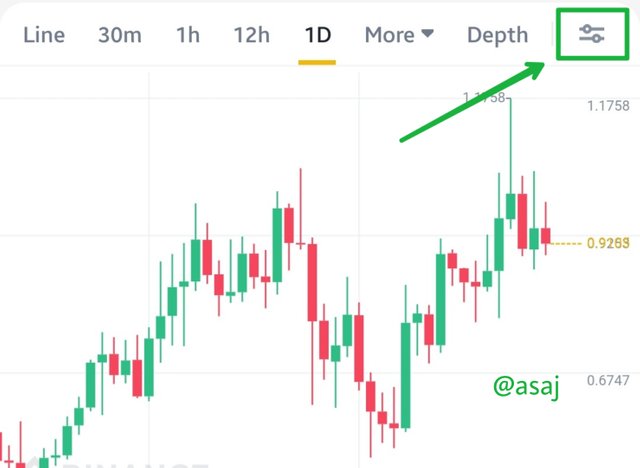
- Click the settings icon on the top right corner of the chart
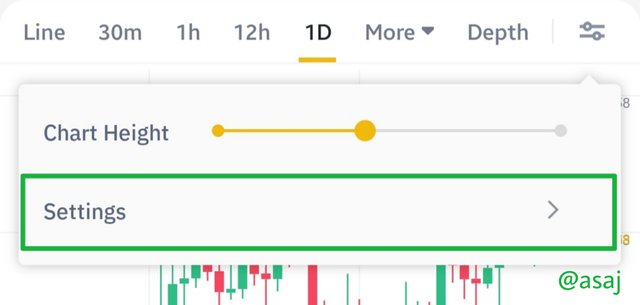
- Now select the [Settings] option
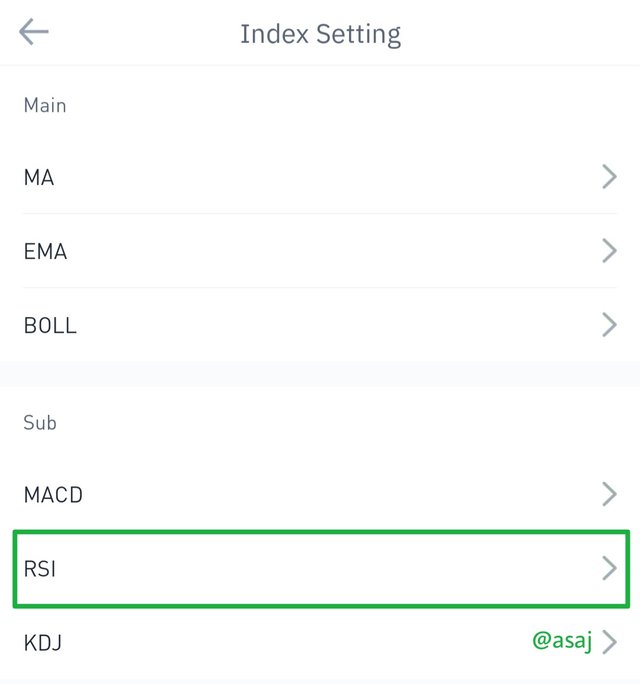
- Click on [Index Setting] from the list provided
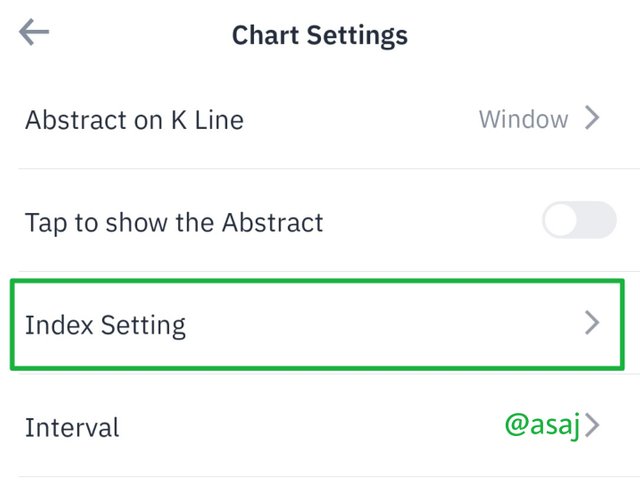
- Press the [RSI] option from the sub category
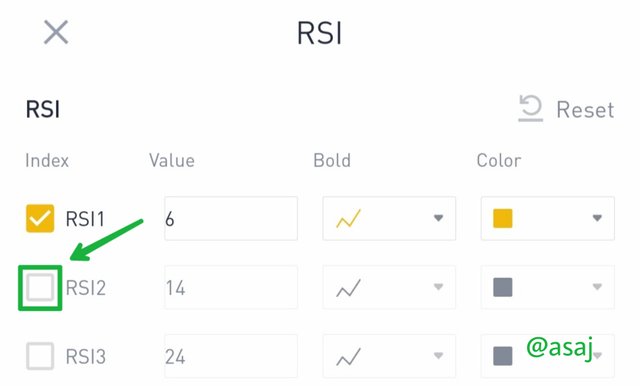
- Tick the RSI2 box to change the RSI period to 14
- Pick a chart line and colour
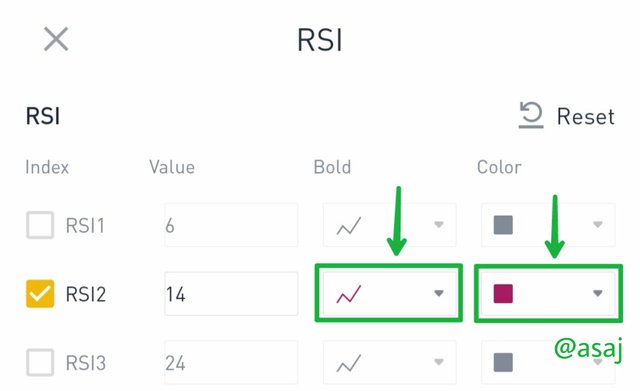
- Now we can see the configured RSI movement with red lines
Why RSI is Often Set at 14 by Default
When J. Welles Wilder developed Relative Strength Index (RSI) in 1987, he recommended that the given period should be set at 14. Fourteen time period means it can be 14 weeks, 14 days, 14 hours and more.
However, Binance uses a default of 6, but traders have an option to increase it to 14 and 24.
The Interpretation of Overbought and Oversold
Overbought
An asset is said to be overbought when the value of the RSI goes beyond the 70 mark. This means that buying have pushed the price very high, and as a result, a price pull-back is expected to occur. A price pull-back often occurs soon after an asset is overbought, then the asset experiences a drastic fall in price.
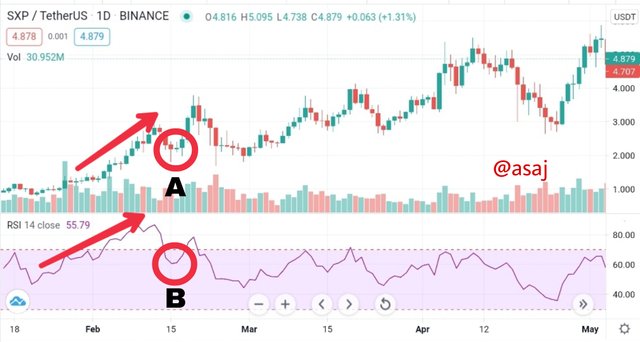
The chart above shows SWIPE was overbought at the beginning of February and this led to an increase in the price of SWIPE. However, on February 15, a price pull-back occured and we see the price fall to point A.
When an asset is overbought, there are usually more buyers than sellers in the market. Later on, the market will experience a correction.
Oversold
We say an asset is oversold when the value of the RSI falls below 30. The selling will push the price of the asset to low levels. As such, price bounce is expected to occur. Price bounce soon follows after an asset is oversold, and the asset recovers from the low prices.
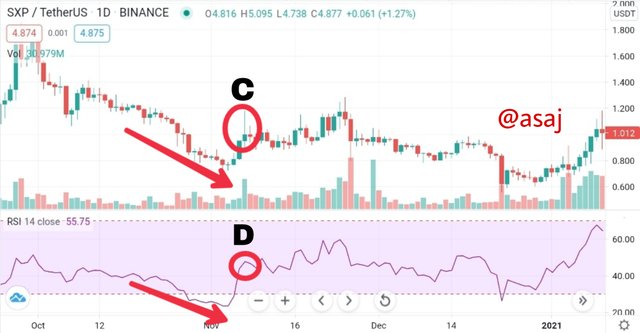
The graph indicates that SWIPE (SXP) was oversold in November. As a result, we see the price of SWIPE fall as well. Also, the RSI goes below the 30 mark, but as expected the RSI of SWIPE rises quickly from the oversold region. Thereafter, the price bounced to point C. We see the RSI value rise as well in point D.
We can, therefore, say that there were more sellers of SWIPE than buyers on the 1st of November 2020. Few days later, a market correction occured.
How to Filter RSI Signals
There are situations when RSI can give confusing signals. For instance, when there is a bullish divergence or a bearish divergence.
Bearish Divergence
A bearish divergence occurs when there is a significant drop in the value of RSI, however, the candlelight chart pattern does not indicate a corresponding drop in price.
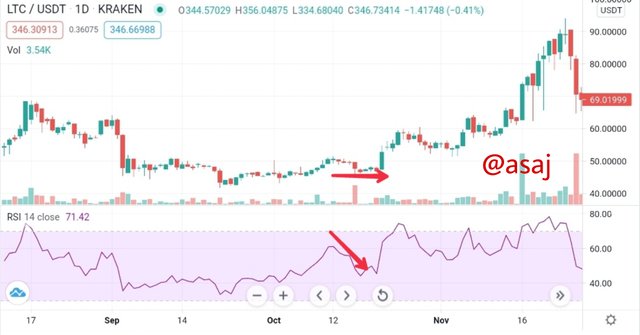
In the chart above, we observe LTC/USDT pair experience a drastic drop in the RSI value. However, the candlelight chart pattern does not indicate a similar drop in price. This is known as a bearish divergence.
Using Accumulation Distribution Indicator (AD) to filter RSI Signals
With that said, I can use a volume indicator to filter the noise of RSI as indicated below;
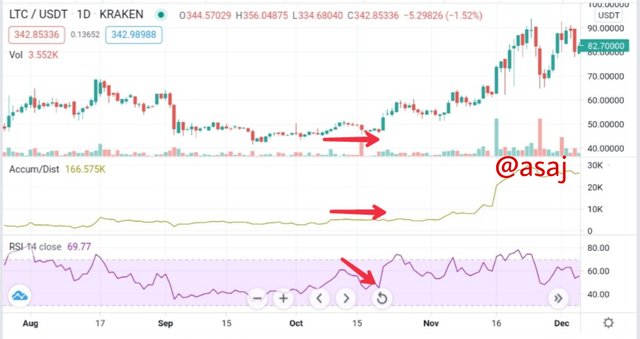
In the chart above I have added Accumulation Distribution Indicator (AD) to the same chart of LTC/USDT pair. AD measures the inflow and outflow of money from the investment in an asset. It can be observed that the AD value has maintained a fairly consistent level below 10k. Thus, the AD has helped me to filter the noise of RSI.
If the AD line had followed the RSI downtrend, it would have confirmed that there are more sellers than buyers in this trade and the price of LTC would have succumbed to the selling pressure, and thereby fall later on.
A fairly straight horizontal AD line indicates that the volume of sales and purchases are at equilibrium. In other words, they are cancelling out each other almost equally.
While RSI tracks minor changes, AD tracks the overall changes in sales and purchases of a given asset.
Reviewing a Chart to Present Various Signals
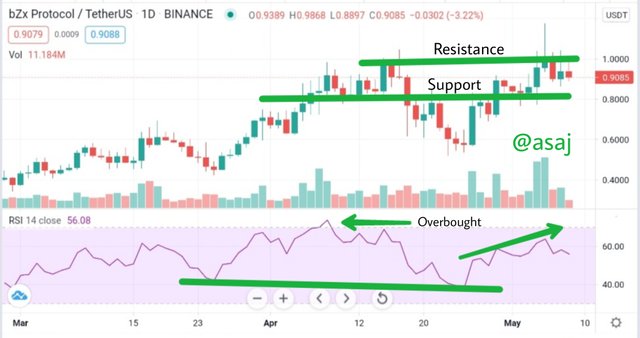
I have chosen a BZRX/USDT pair to analyse as shown below:
Candlelight Pattern Analysis
From the chart above we can see that BZRX/USDT has met a resistance at $1 price level in two occasions. In the second instance, BRZX broke the resistance and then fell a little. It is yet to touch the support level at $0.8.
This is a good time to buy because BZRX have a tendency of turning resistance level to support level. I predict that BZRX will reach the $1.2 price within the next one week. Let's find out if RSI agrees with my forecast.
RSI Analysis
It is observed from RSI values that BZRX have not be oversold during the period of analysis, in fact, it barely touch the 40 RSI value. This indicates that traders are holding on to their positions. Also, it reflects buyers confidence in the coin's ability to maintain a high value. At one instance they even overbought.
In addition to that, it is observed that there are more buyers than sellers in the BRZX/USDT trade and there is a strong tendency for BRZX to be overbought again.
Therefore, the price of BRZX is about to experience a rise. This is in agreement with my candlelight pattern analysis.
Final Words
In summary, we have learnt that RSI is an important indicator in the analysis of the value of an asset. Despite this fact, it is not advisable to rely on RSI alone. Other stochastic indicators should be used alongside with RSI because RSI can give false signals at times.
Professor @kouba01 lecture and task has been very informative and useful to me. Doing this homework broaden my knowledge about Relative Strength Index (RSI) and Accumulation Distribution Indicator (AD).
About finding the buried treasure, obtaining the GPS longitude and latitude coordinates will definitely be the best bet. I wish you success in your endeavour.
NB:
Screenshots are from Binance and TradingView.
Cover image created by me on Snapseed.
You have explained very well about Crypto currency, I have received a lot of knowledge and if I have any problem, I will tag you inshaAllah.
Hello @asaj,
Thank you for participating in the 4th Week Crypto Course in its second season and for your efforts to complete the suggested tasks, you deserve a 10/10 rating, according to the following scale:
My review :
An excellent article showing that you took the time to understand all aspects of the RSI enabling you to answer all questions clearly and precisely.
Thanks again for your effort, and we look forward to reading your next work.
Sincerely,@kouba01
Thank you @kouba01 for taking the time to read my work and for appreciating the effort I invested into this work, means a lot to me. I wish you comfort in your work.