[Trading Using Wedge Pattern] - Crypto Academy / S5W5 - Homework Post for @sachin08
1. Explain Wedge Pattern in your own word.
To analyze the direction of the market, you can use technical analysis. In technical analysis, there are various patterns. On this occasion I will discuss the wedge pattern. The wedge pattern is a chart pattern that is often used to observe market direction. This pattern is a form of price accumulation after experiencing a strong trend. This pattern can also indicate a reversal so that it can determine the direction of the market going forward.
This pattern is also formed by two trend lines drawn in the same direction, the upper level trend line serves as resistance and the lower level trend line serves as support. This wedge pattern has 2 types, namely: Rising Wedge and Falling Wedge. Trend, there will be a market reversal in the opposite direction, at that time the volume will decrease.
To analyze using this wedge pattern, the market must be in a bullish trend or in a bearish trend. In a market that is forming a bullish trend, the rising wedge pattern can be used, this pattern is valid when the price moves upwards and the two trend lines meet and a price break occurs so that the market direction is opposite to the price, then this pattern is valid to use.And vice versa with the falling wedge pattern. The following is an example of a rising wedge and a falling wedge.
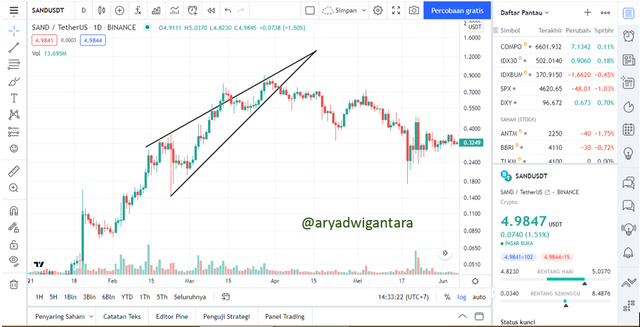 SAND/USDT chart fromTradingView
2. Explain both types of Wedges and How to identify them in detail. (Screenshots required)
In the following, I will explain the two types of wedges, namely the rising wedge and the falling wedge. Well, let's start with the rising wedge.
Rising Wedge
When the market is in a bullish trend, there are several chart patterns that can be used in technical analysis, such as the rising wedge pattern. Rising wedge is a market that is experiencing a bullish trend and then a break occurs on the trendline, then the market will reverse in the opposite direction which is usually called a downtrend.This rising wedge uses 2 trendlines that act as support and resistance, these two trend lines will go in the same direction until they meet the end point of each trendline (Converge). The price is in the opposite direction. The following is an example of the rising wedge pattern on the price chart below.
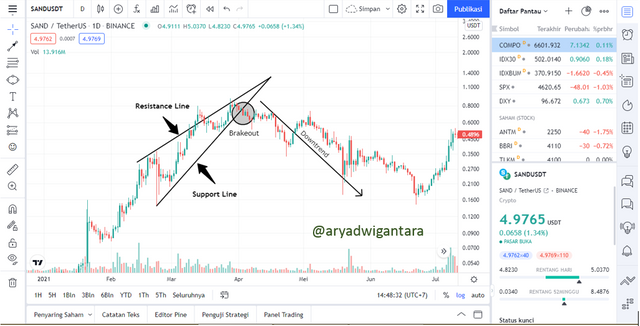 SAND/USDT chart fromTradingView
How to Identify the Rising Wedge Pattern
• To start identifying the market using the rising wedge pattern, first draw 2 trendlines, one at the top of the price which acts as resistance and the other below the price that acts as a support.
• Then make sure that there are at least 5 points that touch the trendline line. Can be 3 touches on the top 2 touches on the bottom. Conditions that should not be done in this pattern should not be less than 5 touches on the trendline.
• Don't forget to also consider the volume and pay attention if it is considered reduced. To determine the entry point it is better when the price has broken the trendline.
Falling Wedge
The falling wedge is the same as the rising wedge, the only difference being that the falling wedge is in a downtrend. The falling wedge is a change in market direction from a downtrend to an uptrend after a price breakout occurs on the trendline.This pattern also focuses on 2 trendlines, one above the price as resistance and one below the price as support, these two trend lines move in the same direction and when the two lines converge (converge) with each other at the end. . The following is an example of a falling wedge pattern on the price chart below.
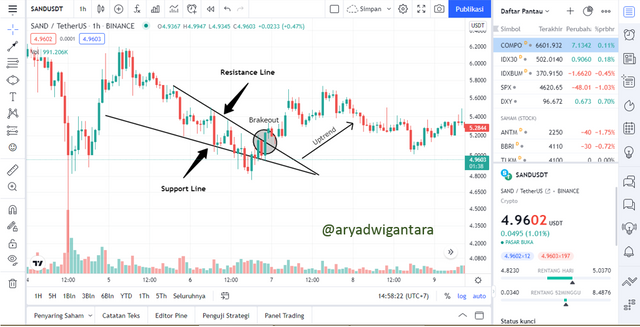 SAND/USDT chart fromTradingView
How to Identify a Falling Wedge Pattern
• The main thing to do is to draw two trendlines one above the price which acts as resistance and one below the price which acts as a support.
• Then make sure there are at least 5 points that touch the trend line, it can be 3 touches below and 2 touches above. At least 5 points that touch the trend line and cannot be less than 5.
• Don't forget to also consider the volume and pay attention if it is considered increasing. To determine the entry point it is better when the price has broken the trendline.
3. Do the breakout of these Wedge Patterns produce False Signals sometimes? If yes, then Explain how to filter out these False signals.
In analyzing market prices sometimes it is not always accurate, sometimes it can be very dangerous for traders, sometimes it can give profit to traders. In this wedge pattern, sometimes it can give misleading signals, a break in the wedge pattern also produces wrong signals. To be able to filter out these false signals by using indicators entered into trades.In analyzing the movement of the market direction, whether it is in a trend or sideways, you cannot fully rely on chart patterns, sometimes you need indicators too. Most crypto traders to assist in the analysis often add indicators in all their trades, so that they can maintain profit opportunities and can reduce the traders' losses.
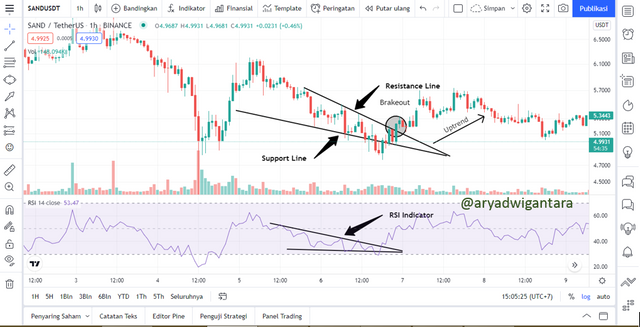 SAND/USDT chart fromTradingView
In this section I will use the RSI (Relative Strength Index) indicator. This RSI identifies possible overbought and oversold areas. The overbought zone is a zone where the position is overbought and the oversold zone is an oversold zone. The overbought zone suggests a sell order on the rising wedge, and the oversold zone indicates a buy order for the falling wedge.
4. Show full trade setup using this pattern for both types of Wedges.( Entry Point, Take Profit, Stop Loss, Breakout)
Rising Wedge trade set-up
To set the entry point, stop loss, and take profit on the rising wedge. First look at the market that is experiencing an uptrend, then draw a trendline above the price and below the price, when the two trendline lines meet and then check whether the price has broken through the trendline support.
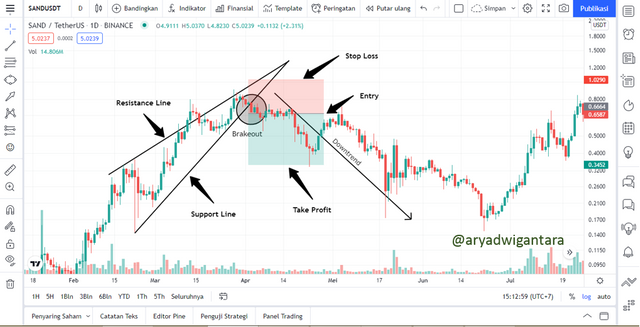 SAND/USDT chart fromTradingView
To determine the entry point after the price breaks the trendline support, then you can make an entry and ensure that the volume is down. The stop loss point is above the trendline resistance, the take profit is between the support and resistance.
Falling Wedge trade set-up
The application of the falling wedge pattern is when the market is forming a downtrend. Then draw 2 trendlines, one above the price and the other below the price. This pattern is valid when the price has broken the trendline resistance.
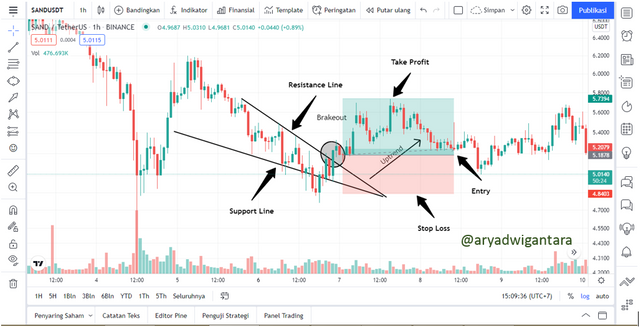 SAND/USDT chart fromTradingView
To determine the entry point after the price breaks the trendline resistance, then you can make an entry and ensure that the volume is up. The stop loss point is below the trendline support, the take profit is between the support and resistance.
Conclusion
In technical analysis, there are many trading patterns that can be used and the wedge pattern is one of them. This pattern can be used in a bullish trend or a bearish trend by relying on two trendlines that meet at the end of the price before a price break occurs in the application of the pattern.There are two types of the wedge pattern is the rising wedge which is applied when the market is in an uptrend, when the price breaks through the trendline support, the price will change direction. Meanwhile, the falling wedge breaks the trendline resistance so that there is a change in direction from a downtrend to an uptrend.
