Trading strategy with the VWAP indicator - Crypto Academy/S5W5 - Homework post for @lenonmc21
1. Explain and define in your own words what the “VWAP” indicator is and how it is calculated (Nothing taken from the internet)
Volume Weighted Average Price (VWAP) is one of the greatest indicators and is often used by traders in making decisions in crypto trading. This indicator depends on price and volume, which gives the average trading price of a particular asset in a per day calculation. This can give traders an idea of what trend is going on and this indicator only uses one line on the chart that moves following the calculation of price and volume.
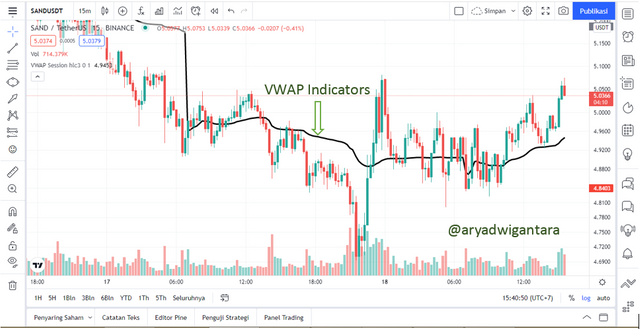
Traders when they want to make a purchase using this indicator first see where the price is at VWAP, if the price crosses above the VWAP then the trader can make a sale, if the price crosses below the VWAP then the trader can make a purchase. If the candlestick is above the VWAP line, then on at that time the price was in a bullish trend, if it is below the VWAP line then the market is in a bearish trend.
» How To Calculate the VWAP indicator
To calculate this VWAP indicator, there are 3 important features that are part of the VWAP indicator:
•Price
•Volume
•Numbers of candles per day
In the VWAP indicator it is calculated by adding the price traded and the volume of the asset, then divided by the number of candles per day.
Here's the VMAP formula
•VWAP = P + V$T / NDC
description:
P=Price
V$T =Volume of asset traded
NDC=Number of daily candle
2.Explain in your own words how the “Strategy with the VWAP indicator should be applied correctly (Show at least 2 examples of possible inputs with the indicator, only own charts)?
In this section I will describe how to properly implement the VWAP indicator and how to use it by combining chart patterns and other indicators. In the following I will show you an easy-to-understand way to add the VWAP indicator to the market chart you want to analyze and how to configure it.
• At first, I opened a social trading platform. On this occasion I used the https://id.tradingview.com/ site.
• If the front page of the trading view site appears, then go to the chart on the left side menu of the trading view. In the chart display at the top of the chart look for the words “Fx indicator”. Then click it.
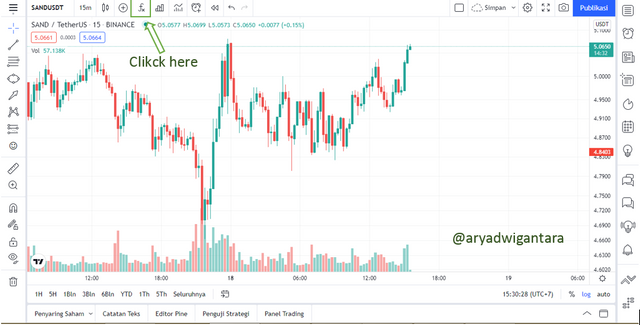
• If you have clicked it will display the "Fx indicator", then type in the search section by typing "VWAP", then the intended search results will appear.
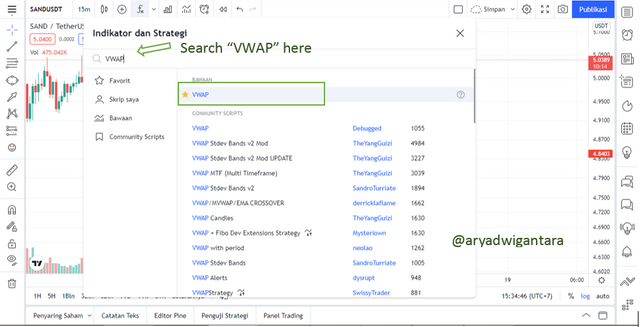
• If the VWAP indicator has appeared on the chart, the next step is to configure the indicator by pressing the gear logo on the top left. Then remove the "Upper Band" and "Lower Band" options, then click "VWAP" then select the thickness by selecting the maximum thickness. After that click “OK” to apply changes to the chart.
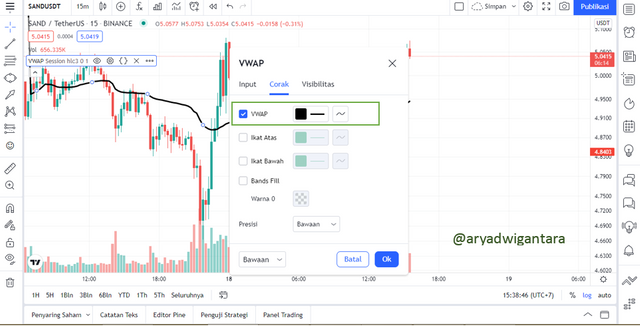
• After configuring the VWAP indicator, a line will appear on the chart which is a line from VWAP, as shown in the chart below
» Things that need to be done for the implementation of a good and correct VWAP strategy.
The following are the steps that must be considered carefully in using the VWAP indicator properly and correctly.
• Bullish or Bearish Structure Break: the first thing to do is identify the price from the last high or low by looking at the trend we are observing, then wait for the candlestick to break above the VWAP line or below the VWAP line. Clear price on the highest or lowest price on the chart.
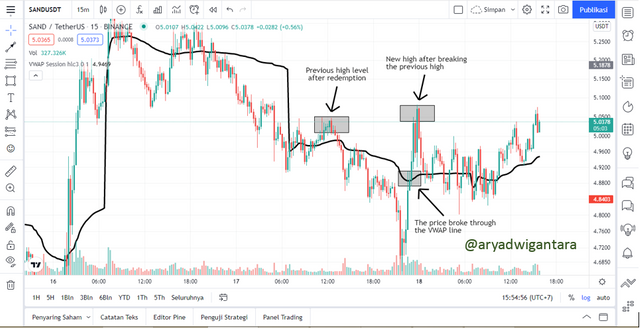
• Retracement to the VWAP/Use of fibonacci: after an impulsive move breaks through the previous high or low, the price will retrace. When the price retraces towards the VWAP line, this is done later by pulling the Fibonacci retracement from the lower price level to the lower level. Price level up or the opposite occurs. Then wait for the price to touch the 50% or 61.8% level, these two levels are entry points according to this VWAP indicator strategy.
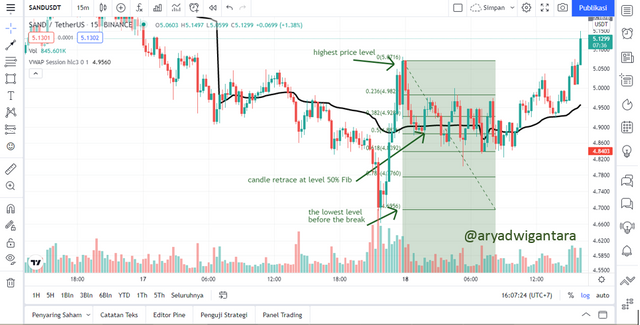
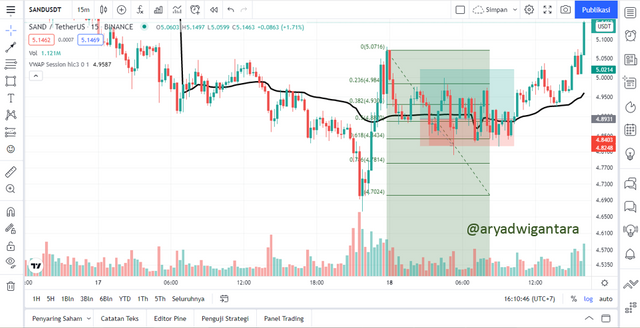
• Risk Management: to set the stop loss point, when the price touches the 50% or 61.8% zone of the Fibonacci retracement, then the stop loss is placed below the level of 50% or 61.8%. From the take profit point using a 1:2 ratio or about 1.5 to 2 pips from the stop loss, depending on the respective traders in determining the take profit point.
3.Explain in detail the trade entry and exit criteria to take into account to correctly apply the strategy with the VWAP indicator?
In the following, I will explain in detail about the entry and exit criteria in applying the VWAP indicator properly and correctly on the chart. I will explain for the bullish trend and the bearish trend, either way:
• As I explained above, the first thing to do is to make sure the price must first penetrate the structure, which means the highest level or lower level must be broken first. Can result in a false signal. Therefore, it is very important to note.
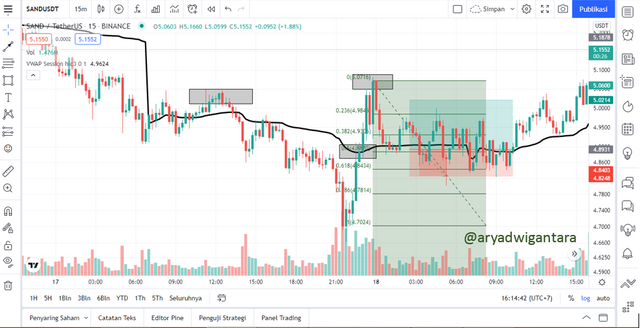
• When the price has broken through the upward or downward structure by following the direction of the current trend in the market, then wait for the price to retrace to the VWAP line, when the price has traced towards the VWAP line, then pull the Fibonacci retracement from the low level and high levehl,when the price touches its retracement level between 50% or 61.8%, traders can take entry positions, if the price does not touch the retracement level then it is invalid.
• To place a stop loss point, it is better to be below the 61.8% level on the Fibonacci retracement, so that the risk ratio obtained will be smaller.
• For take profit, a ratio of 1:1.5 or 1:2 is recommended from the stop loss point, so that the profit obtained can be 1.5 to 2.
An example of taking an order is as follows.
PRACTICE
1. Make 2 entries (One bullish and one bearish), using the strategy with the “VWAP” indicator. These entries must be made in a demo account, keep in mind that it is not enough just to place the images of the entry, you must place additional images to observe their development in order to be correctly evaluated.
ORDER BUY
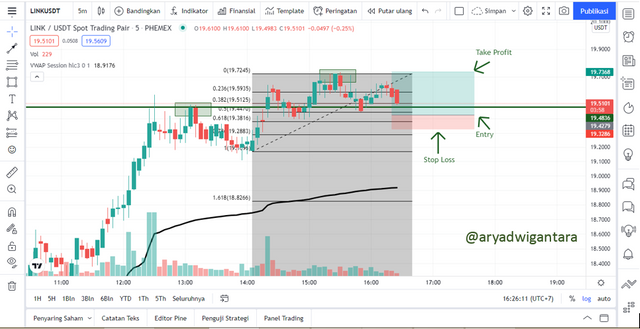
I placed a buy order on the market LINK/USDT on the timeframe 5M it looks like the price has reached the highest level from before which it has broken. And the price has also broken the VWAP line upwards. Then at the highest level, the price is waiting for the price to retrace to the VWAP line that was broken earlier. The price is the highest level 0 to 100.After pulling the Fibonacci and then waiting for the price to retrace to the 50% to 61.8% retracement level on the Fibonacci. It looks like the price has touched the 50% retracement level I made an entry order by setting the stop loss below 61.8% and Take profit is adjusted according to a 1:2 ratio from the stop loss point. The following shows the chart that I use for analysis and entry.
SELL ORDER
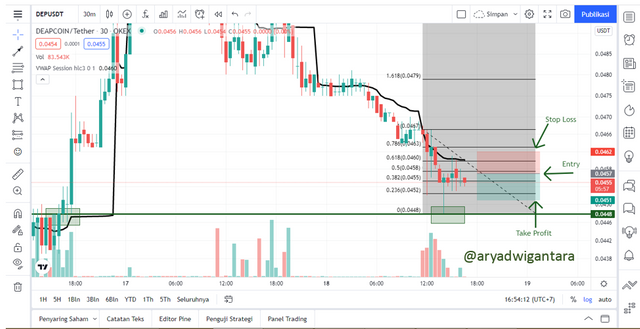
In the sell order section I do the mark LINK/USDT on the timeframe 30minute as seen in the chart the lowest price level formed has occurred a breakout of the structure marked by a horizontal line. Then I waited for price movement to retrace to the VWAP line, then pulled the Fibonacci retracement from the highest point to the lowest point at 100 to 0 and saw the 50% retracement level and 61.8%.When the price touched the 50% retracement level I placed a sell order and set the stop loss point above the 61.8% level. At the take profit point I set the risk ratio with a ratio of 1:2, so that the take profit point was two times the stop loss point. The following shows the graph that I use for analysis and entry.
Conclusion
In technical analysis the indicator is one part of technical analysis, the Volume Weighted Average Price (VWAP) indicator is one indicator that is often used by crypto traders. VWAP can help traders to know the direction of the trend and can determine in decision making. Combined with the market structure and Fibonacci retracement, so that it can determine the entry point properly and correctly.This indicator is price and volume dependent which gives the average traded price for a particular asset in per day calculations.