Reading special bar combination- Crypto Academy / S5W8 - Homework Post for @sachin08
Hello all friends
come back with me @aryadwigantara
on this occasion I will try to complete the task given by professor @sachin08 regarding Reading special bar combination.
So let's take a look at my following review together
Reading special bar combination


1.) Explain Price Bars in your own words. How to add these price bars on Chart with proper screenshots?
In the crypto market, traders must first know and understand about price bars because price bar traders are a means to analyze future crypto prices. The price bar consists of two lines, namely a horizontal line that is useful for opening and closing prices and a vertical line that is useful for providing an overview of prices. lowest and highest in a certain period. Broadly speaking, the price of the bar indicates the opening and closing prices as well as the highest and lowest prices.
To identify the price bar is the same as looking at the green candlestick which means bullish and the red color means bearish. To find out the color of the price bar by checking and seeing the closing price above the opening or closing below the open.For the green color it is marked by the close above the open and the color close above the opening. Red is indicated by the close being below the open.

In the following I will explain the function of horizontal lines and vertical lines.
1: Open: indicated by a small horizontal line which is usually located below the left side or above the price bar
2: Close: a small horizontal line (green or red) which is usually located above the right side and below the price bar
3: Height: located at the top of the vertical line of the price bar (green or red)
4: Low: located just below the vertical line on the price bar (green or red)
How to add price bars on a chart.
The first thing to do is to visit the trading platform, on this occasion I use https://id.tradingview.com/
Step 1
Open the chart on the tradingview platform, then select the token you want to analyze, then click on the section marked in the green box below

Step 2
Select the bar and click as shown in the green arrow below

Then the graph display has changed to a bar as shown below.

2.) How to identify trends using Price Bars. Explain for both trend. (Screenshots required).
To start identifying trends using price bars is very simple, traders only need to know well about the pattern of higher highs and higher lows during an uptrend and lower highs and lower lows during a downtrend.
Identifying an uptrend
To identify an uptrend on a chart using price bar, traders only need to make sure that the price is forming a higher high and higher low pattern from the previous high. Next, make sure the closing price is higher than the previous close and also the price must create the latest high and the close is higher than the opening.And the lower price must be higher than the previous low price, if the pattern has been formed then traders can take an entry in the trade.

Identifying downtrend
The first thing a trader should do is make sure the price has formed a series of lower highs and lower lows, starting with bars that form lower highs and lower lows that are lower than the previous low. A downtrend begins with bars that form lower highs and lower lows. Lower than before, so that it can confirm to traders to sell their assets so they don't experience big losses.

3.) Explain the Bar Combinations for Spending the Day inside for both conditions. (Screenshots required).
Spending the day is also known as the inner day, it is interpreted as a combination of bars which refers to the reluctance of prices to move at the top level or at the bottom level of the previous bar which indicates the market is in doubt.There are two price bars that are included in the inside day, namely the mother bar is marked with the previous bar and inside bar is indicated by a small bar that is inside the previous bar.
The combination of these two bars can indicate traders are in an indecisive phase in the market, which means buyers are hesitant to buy assets and sellers are hesitant to sell their assets in the crypto market. This will lead to the formation of an inside day where the bar is smaller than the previous bar.
Certain criteria must be met to identify bar combinations on a graph:
• The high level must be lower than the previous high
• The low level must be higher than the previous low.
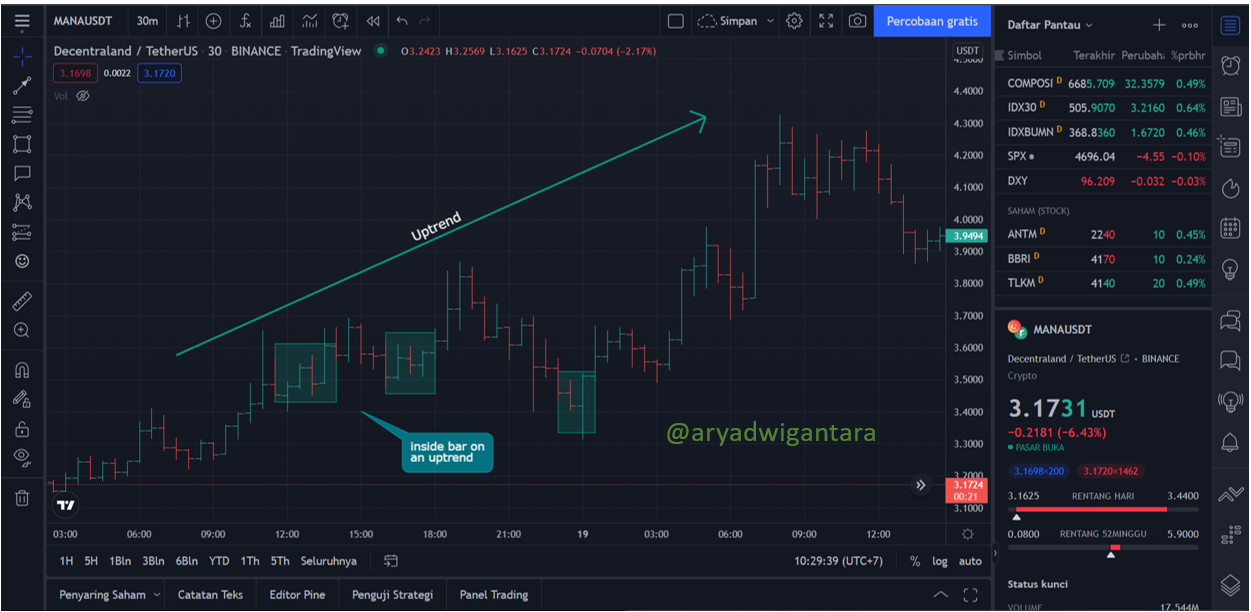
Inside bar for an uptrending market
The chart shows a combination of bars for an inside day in an uptrending market, this is usually called a “buy signal inside the bar”. When a combination is formed, buyers and sellers feel hesitant to sell or buy in the crypto market.
Inside day for a downtrending market
This chart indicates a combination of bars for inside days when the market is in a downtrend, it can also be referred to as a “sell signal inside the bar” in which case buyers and sellers are hesitant to sell or buy their assets in the crypto market.

4.) Explain the Bar Combinations for Getting outside for the Day for both conditions. (Screenshots required).
Exit today can also be called outside day. Outside day, which means that the high and low range of a bar must be outside the previous bar. In contrast to inside day, outside day ranges the opening and closing are always outside the bar. Outside bar can be in an uptrend or downtrend and can also indicate a trend reversal or continuation of the trend direction but depending on the opening and closing.

On the chart it can be seen that the opening was at the lowest point and the closing was at the high point, this is expected to be a continuation of the uptrend and a reversal in the downtrend.

Just like the previous chart, on this chart the opening point is at the highest point and the closing point is at the lowest point, this is expected to continue from the downtrend and then reverse into an uptrend.
5.) Explain the Bar Combinations for Finding the close at the open for both conditions in each trend. (Screenshots required).
The closing strategy at the time of the opening is a strategy that is used for a combination of bars when determining the continuation of the current trend or can be a determinant of a trend reversal., then traders will use this bar combination strategy to predict the direction of the trend continuation or a trend reversal in an uptrend or downtrend.
close at the open for an uptrend
On the chart it can be seen that the price is in an uptrend with the closing point referring to the opening point adjacent to the lowest point area, this indicates a trend reversal signal before the reversal occurs.

Close at the open for a downtrend
Just like in an uptrend, in a downtrend the closing point refers to the opening point near the highest price area, this indicates a reversal of the trend direction from the previous trend direction.

Conclusion
Price bar is a strategy that is very easy to apply to the charts, this strategy is used by traders to analyze the continuation of prices in the market and to assist traders in making decisions before entering the market.
I thank Prof @sachin08 who has been willing to share his knowledge about price bars, thanks to the knowledge of Prof. I have been able to understand bar combinations, can identify the continuation of the trend direction in the market, and know the combination of opening and closing bars and inside and outside bars. Thank you prof for this extraordinary knowledge, hopefully it will be useful for traders.
