[Confluence Trading] - Crypto Academy / S5W6- Homework Post for @reminiscence01
Hello all friends
come back with me @aryadwigantara
on this occasion I will try to complete the task given by professor @reminiscence01 regarding Confluence Trading.
So let's take a look at my following review together
Confluence Trading


1. Explain Confluence trading. Explain how a trade setup can be enhanced using confluence trading.
The crypto market is a market with rapid price fluctuations, so knowledgeable traders will wait for the confirmation candle to start trading. Traders first analyze the market so that there is no big loss for traders, in analyzing traders often combine two or more indicators to support the analysis so that it can determine good risk management.
Confluence trading is the use of two or more indicators in analyzing so that they can give the same result. Confluence trading that gives the same signal results occurs due to the use of trading strategies and combined with indicators to produce the same signal. Confluence trading is very helpful for traders in analyzing crypto market, so that traders can profit in the market and can avoid false signals.
Trade Setup can be improved when traders use more than one indicator in making decisions so that they can make good decisions. Decisions taken by traders require a strong mentality so that by recognizing them in advance, they can build confidence in determining the entry point that is in accordance with the results of the analysis for traders. Here is a graphic display of the confluence trading usage.

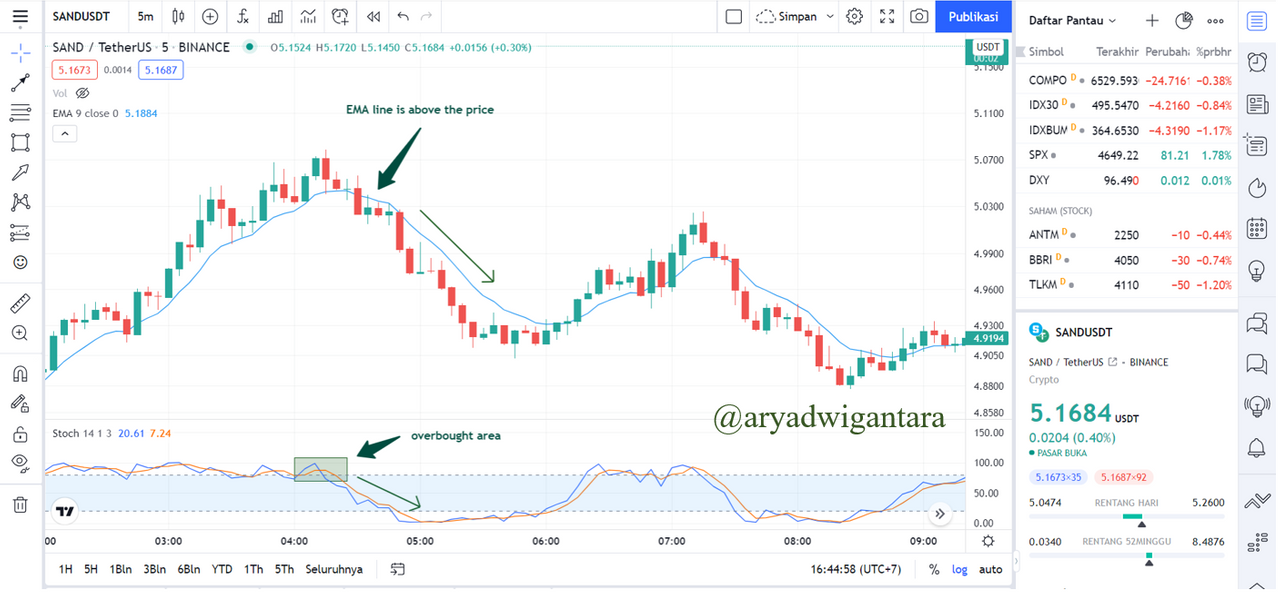
In the example above, I used confluence trading, there are two indicators that I use, namely the stochastic and the exponential moving average.On the stochastic indicator when it enters the overbought region (80-100) while the exponential moving average line is above the candlestick, traders can place a sell order. Buy order the stochastic line enters the oversold area (20-0) which is the oversold area and the exponential moving average line is under the candlestick.
Let's look at the chart above, the green arrow indicates the stochastic line has reached the overbought area which indicates to place a sell order, while the exponential moving average line is above the candlestick.This is called a trade confluence of 2 indicators giving the same signal. I have given above, it appears that in trading meetings by combining 2 indicators can provide greater opportunities for profit, so that it can reduce errors in analyzing and can avoid if there are false signals.
2. Explain the importance of confluence trading in the crypto market
In trading on the crypto market, there are important things in the implementation of meeting trading. Here are some important things in meeting trading which I will explain below.
• Increase Chance of Winning:Meeting trades can increase the chances of winning in the crypto market. As I explained in the first question, it looks like the stochastic and exponential moving average lines provide an overview of signals that are in accordance with the concept of placing a sell order. So using 2 or more indicators can increase the chances of winning.
• Good Risk Management: Risk management is the next important part of meeting trading. Risk management aims to minimize the risk of large losses, so good risk management is needed. Risk management plays an important role in determining stop loss points and take profit points, so traders can confirm the target market.
• Filtration of False Signal:False signals often occur When traders only focus on technical analysis. Sometimes traders often find false signals so that it does not go according to what traders expect.By implementing confluence trading can help solve if there are false signals in the market. In confluence trading, two trades are required or more confirmation of a buy or sell signal, so that if the first indicator gives a sell signal, the next indicator must be the same as the first indicator, it will avoid false signals.
• It Increases Traders Confidence:Confidence is needed by traders. When technical analysis has been carried out with the help of the indicators used provide signals that are in accordance with the analysis, therefore it can increase the confidence of traders to enter the market and place orders according to the analysis.
• It Enhance Trading Skill and Accuracy: Traders who often use technical analysis in their trading, and continue to use the same analysis will improve their skills and accuracy in trading, so that predictions become more accurate. Technical.
3. Explain 2-level and 3-level confirmation confluence trading using any crypto chart.
2-Level Confirmation Confluence Trading
The use of two or more indicators to confirm signals on the trading market. This experiment is carried out to sort out false signals that may appear using only one strategy. This is done by combining indicators with chart patterns, the application of this type of strategy will suit the way traders trade.
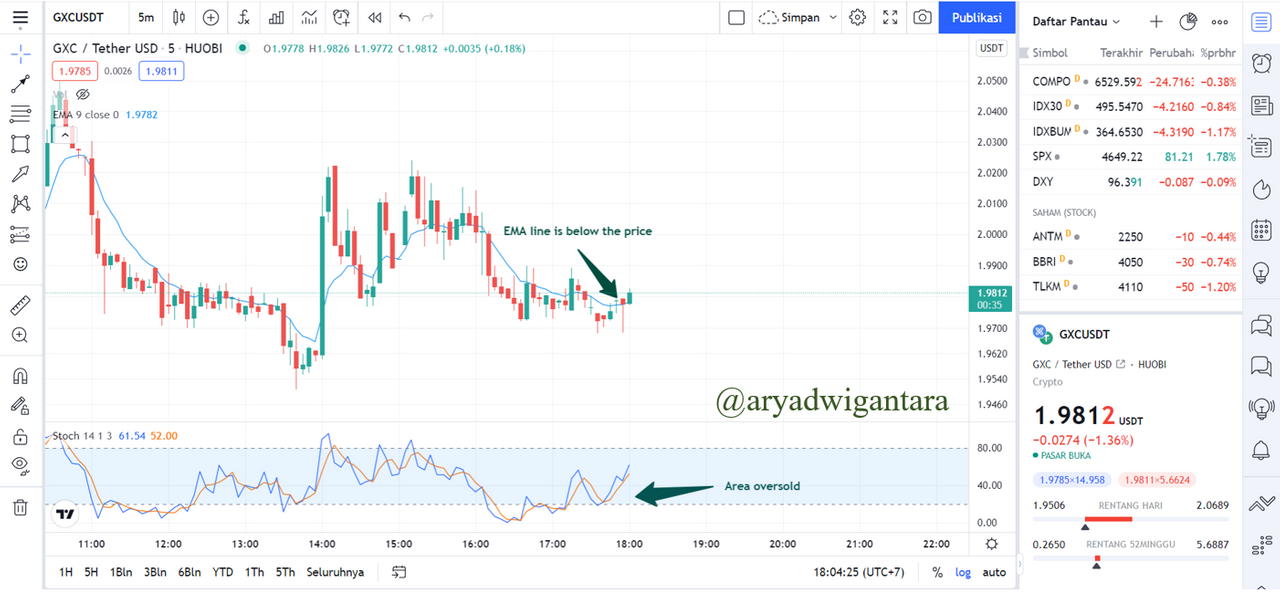
From the chart above, it can be seen that the confluence of the stochastic and exponential moving average indicators has the same goal. The stochastic has touched the overbought area as indicated by the green arrow, if the market has touched the overbought area on the stochastic, it means that a bearish movement will occur.While on the exponential moving average, the candlestick has crossed the EMA line so that the candle is already below the EMA line. Both of these things indicate that the market will move in a bearish direction after confirming the two strategies I used.
3-Level Confirmation Confluence Trading
The 3-level confluence trade will provide a higher level of accuracy compared to the 2 level. This 3-level confluence trade uses 3 strategies or Techniques to confirm signals on the trading market.

In the chart above the stochastic line has entered the overbought area, as we know if the line has entered the overbought area on the stochastic it means that the market will experience a downtrend, this is the first confirmation which is marked with a green arrow on the chart.The market has not formed a higher high from the previous high, causing a break of the previous low which is marked with a green box on the chart, this indicates the second confirmation which indicates the market will experience a downtrend. Downtrend in the market. In this section I use the stochastic, market structure and exponential moving average to confirm signals on the market.
4. Analyze and Open a demo trade on two crypto asset pairs using confluence trading. The following are expected in this question. (a) Identify the trend. (b) Explain the strategies/trading tools for your confluence. (c) What are the different signals observed on the chart?
Buy Order
a.) In this section I use the market GXC/USDT on the time frame 5M it can be seen on the chart that the price is experiencing a downtrend and the market structure forms a double top which indicates the lower low does not penetrate the previous lower.
b.) The strategy I use only uses 2 indicators, namely the stochastic indicator and the exponential moving average indicator. These two indicators confirm the buy order signal. When the stochastic indicator touches the oversold area and the price breaks the EMA line upwards, while the sell order indicator the stochastic touched the overbought area and the price broke the EMA line to the downside.
c.) In the chart above, it can be seen that the price has entered the oversold area on the stochastic indicator which means the price will move bullish. The EMA line experienced a price breakout to the top. So these two indicators signaled a signal to place a buy order., I placed a buy order.

In the chart above, I place a buy order, I place the entry point. When the price is above the EMA line and the stop loss point I place below the previous low, and for take profit I place it in a 1:2 ratio of the risk.
Here's a screenshot of the trades I've placed and taken buy orders.

Sell Order
I use the market AXS/USDT on the timeframe 5M as seen on the chart, a series of prices formed a higher high and a higher low, then there was a break of the EMA line downwards and it was also marked by the stochastic indicator that the price had entered the overbought area. So we found two confirmations of the same meeting to place a sell order.

From the entry point I place below the EMA line while the stop loss point I place above the previous low, for take profit I use a 1:2 ratio of the risk of loss.
The following is a display of the sell order I placed on the market.

Conclusion
Confluence trading is a trade that uses 2 or more strategies with the same signal confirmation. Using more than one strategy can avoid false signals. Considering the crypto market is a market with very fast fluctuations so traders are required at least two meetings confirm signals before trading and can also improve the accuracy of trading.The use of the same strategy continuously can improve the instinct of traders and increase confidence in making trades by paying attention to good risk management.