Steemit Crypto Academy Contest / S19W4: Mastering the Sharkfin Model for Trading

Hello everyone! I hope you are all doing well and enjoying life with the blessings of Allah Almighty. I am happy to take part in the exciting challenge hosted by SteemitCryptoAcademy community . So, without any further delay, let's dive right in! Shall we ? ........, Okay , Okay😊! .
Explain the concept of the Sharkfin model. What is a Sharkfin pattern and how can it be identified on a price chart? |
|---|
The Sharkfin model is a way through which traders are helped to locate key changes in prices on the crypto market. It is so named because of the fin of the shark-shaped pattern that forms when prices have risen quickly and then dropped sharply.
The Sharkfin pattern would be identified where the price suddenly spiked and then fell steeply. Otherwise, it would resemble the fin of a shark on a chart of prices. The RSI helps to pinpoint these patterns.
The RSI displays at what speed and what scale the changes in prices happen. High RSI means the price is likely to drop soon; low means it may rise. This allows filtering of some wrong signals.
The Sharkfin model will give the traders a clue about the best moment to buy or sell. By considering important movements of prices, they are not wrong in trading activities.
During the competition week, one learns the Sharkfin model with the Steem token and how to enter and leave trades accordingly, using real-life examples better.
The Sharkfin model explores and enriches trading skills. It opens new approaches toward the crypto market, especially with the Steem token that makes trading more precise and successful.
The Sharkfin pattern looks very distinctive on a price chart, much like the fin of a shark. Its major visual features are the following:
Sharp Rise in Price: First of all, there is a steep but rapid rise of an asset's price. This should be quite dramatic and steep enough that it may well happen over a short period, creating almost a spike.
Sudden Peak: After the rapid rise, the price then hits a high point or peak. This peak is usually pointed and well-defined, forming the top of the shark fin.
Steep Decline: The price, upon reaching this peak, falls swiftly and significantly. This decline is commonly as sharp as the rise that led to it, thereby finishing off the fin shape as the price drops back down.
Volume Changes: Sharp movements in price are usually accompanied by a considerable volume change. While the prices rally quickly, the trading volume would usually increase, thereby indicating strong buying interest. Volume may decrease as the price peaks and starts to decline.
Relative Strength Index Confirmation: Since RSI is a momentum oscillator, it usually offers extremes in the course of a Sharkfin pattern formation. For example, if the RSI goes to high values, usually above 70, that means the security is overbought and the price may soon fall. Conversely, if the RSI shows extreme lows—usually below 30—it results in oversold conditions, hence a possible price increase.
Timeframe Variability: The Sharkfin pattern is an independent event that develops on all timeframes, from minutes to days or even weeks. The point is sharp, quick moves forming a pattern resembling a shark's fin on the chart.
These characteristics, if identified in a price chart, distinguish the Sharkfin pattern and help the trader come up with very informed trading decisions based on expected price reversals.
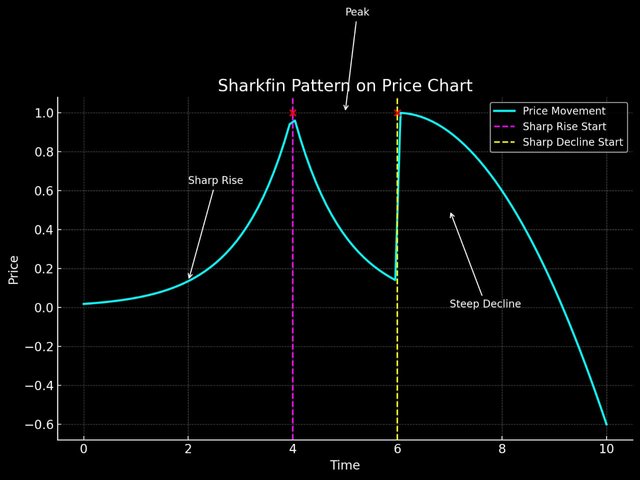
Here's a graph illustrating the Sharkfin pattern.
Main Visual Characteristics:
- Sharp Rise in Price: The initial section shows a rapid and steep increase in price, represented by the cyan line rising sharply.
- Sudden Peak: The peak is clearly marked where the price reaches its highest point.
- Steep Decline: Following the peak, the price falls quickly and steeply, mirroring the initial rise.
- Volume Changes: Although not shown in the graph, volume typically increases during the sharp rise and decreases during the decline.
- RSI Confirmation: The pattern often coincides with extreme RSI readings (overbought or oversold conditions).
- Timeframe Variability: The pattern can form over different timeframes but retains the distinctive "shark fin" shape.
The annotations highlight key points: the sharp rise, peak, and steep decline, making it easier to identify the Sharkfin pattern on a price chart.
Explain how the RSI (Relative Strength Index) indicator can be used to identify Sharkfin patterns. |
|---|
The RSI, or Relative Strength Index, is one of the kinds of momentum oscillators that a lot of traders use to determine the strength and velocity of price movements. It goes up to 0 from 100, and for this indication, readings are usually interpreted as follows: values over 70 mean an asset is overbought, while values below 30 indicate that it is oversold.
The RSI thus can be very useful in picking out Sharkfin patterns, which denote the rapid rise, which is immediately followed by a steep fall in price, resembling a shark fin.
Now, using the RSI for pinpointing a Sharkfin involves the following steps:
- Steeper RSI Increase: A Sharkfin pattern begins with a sudden and steep rise of RSI, normally above 70, which means that there is strong buying pressure in the security.
- Peak RSI: The RSI then reaches a higher level, normally above 70, indicating that the security is overbought. This forms the top of the Sharkfin pattern.
- Sharp Decline in RSI: From the top, the RSI drops sharply, thereby simply pointing out that buying pressure has dropped sharply and selling pressure has risen significantly. Very often, this steep fall brings the RSI back to or below the 50 level.
If traders monitor such RSI movements, they can make out a potential Sharkfin pattern. In this way, they are better prepared for price reversals and hence better equipped while making trading decisions.
Now, apply this understanding to the given trading charts of ETH/USDT on TradingView. These charts are of RSI and price movements, which will make our task of spotting Sharkfin patterns easier.
 TradingView TradingView |
|---|
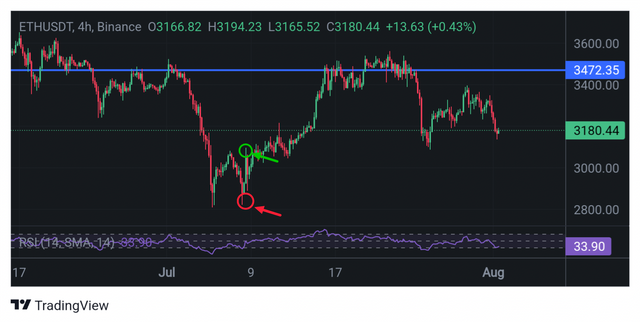
First Chart: 4-hour ETH/USDT on TradingView:
- Sharp Rise and Overbought RSI: The pairing of ETH/USDT started rising rapidly in early July. On a corresponding level, the RSI spikes above 70, which indicates overbuying of the asset. For instance, on 9 July, the price jumped from around $2,900 to $3,150, with the RSI sharply spiking at 75.
- Peak and Decline: The price peaked to almost $3,200 on the 12th of July, while the RSI is surging to approximately 80. From this point forward, the price begins a fast decline, and the RSI subsequently breaks below 50 by the 15th of July. This forms a Sharkfin pattern that identifies the potential reversal point.
 TradingView TradingView |
|---|
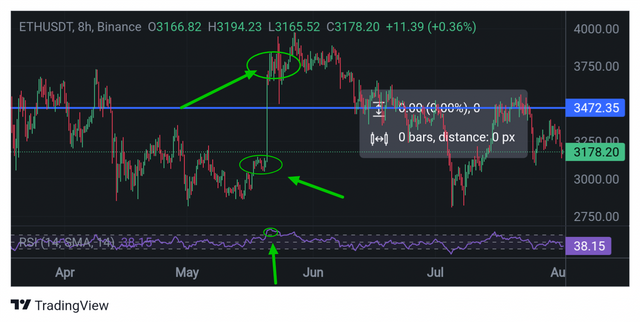
Second chart: 8-hour ETH/USDT on TradingView :
- Sharp Rise and Overbought RSI: Early June sees the ETH/USDT cryptocurrency pair surging in price from around $2,800 to $3,500 while its RSI surges, crossing 70 to rest at approximately 78. This indicates very strong buying pressure and, hence, an overbought condition.
- Peak and Decline: The price had peaked in mid-June to about $3,600, while the RSI reached about 85. Following the peak, the price dropped drastically; at the close of June, price slipped to $3,200. The RSI followed this drop and slid below 50. This steep rise and fall in the price and RSI sharply forms a shark fin pattern.
In these cases, the steep increase of the RSI above 70, overbought conditions, was immediately followed by a steep decline below 50, helping to identify Sharkfin patterns. Such formations are indicative that a reversal is likely to take place, and hence, traders could be able to foresee a change in the price movement so as to make better-informed trade decisions.
Combining the RSI analysis with a close eye on price charts would enable one to spot Sharkfin patterns effectively and thus improve one's trading strategy.
What are the trade entry criteria when using the Sharkfin model applied to the Steem token? |
|---|
Using the Sharkfin model on the Steem token will require criteria to enter a trade following the identification of some patterns and signals. Below are the details of what to look for in these criteria and signals:
Key Entry Criteria
Identify Sharp Price Rise
Watch for a rapid upside price hike of the Steem token. This usually seems like an almost vertical climb on the price chart.
- Example Setup: If the price of Steem rises all of a sudden from $0.15 to $0.25, within a short period of time, consider that a potential Sharkfin pattern is being developed.
Confirm with RSI:
The RSI should also suggest overbought behaviors from this sharp rise. More specifically, the RSI value should head above 70.
- Example Setup: The price of Steem surges from $0.15 to $0.25, with the RSI traveling from 50 to 75, showing overbought conditions.
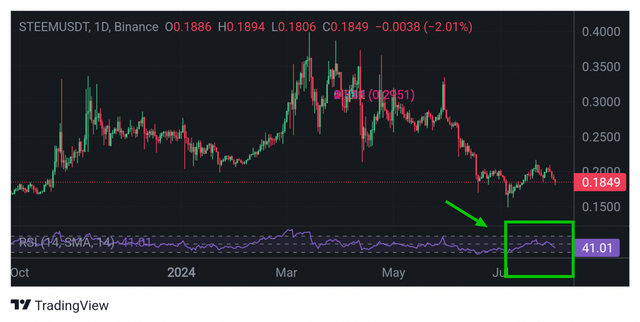
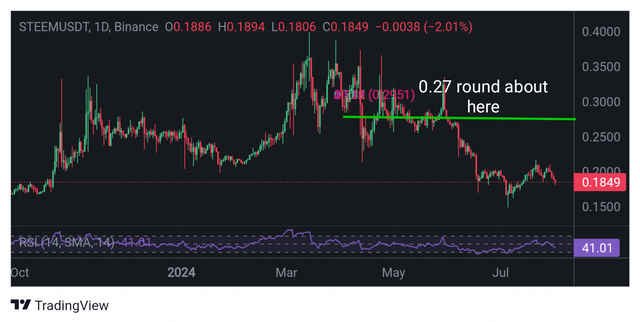
Wait for the Peak:
The price and RSI should reach a peak. Very often, the top of the price chart goes through with the highest RSI value.
 TradingView TradingView |
|---|
- Example Setup: The price of Steem peaks at $0.27 and the RSI hits 78. This peak will show you the top of the Sharkfin pattern.
Sharp Fall in Price and RSI:
When the peak is made, the price should start falling sharply along with the decline in the RSI. The RSI starts falling below 70.
- Setup Example: The price of Steem dives south from $0.27 to $0.23 with the RSI falling from 78 to 65.
Confirm RSI Below 50 for Trigger:
To make an entry in the trade, the RSI should break below 50, thus also confirming that trend reversal.
- Example Setup: Price declines to $0.20, and the RSI declines to 45, hence confirming the strong downtrend.
Entry Signal for a Short Position:
Enter a short position when the RSI moves below 70 after peaking above 70, and the price starts to decline sharply.
- Example Setup: After the price of Steem peaks at $0.27 and the RSI at 78, enter a short position when the RSI falls below 70 (e.g., at $0.25 with RSI at 68).
Entry Signal for a Long Position:
If looking for a long position after the Sharkfin pattern, wait until the RSI hits oversold levels below 30 and starts rising again.
- Example Setup: After the price of Steem drops to $0.18 and the RSI falls to 28, enter a long position when the RSI starts to rise (e.g., at $0.20 with RSI at 32).
Indicators Used:
- Price Chart: Observe the price movements and identify sharp rises and peaks.
- RSI (Relative Strength Index): Monitor RSI values for overbought (above 70) and oversold (below 30) conditions.
- Volume: Increased volume often accompanies sharp price rises and falls, confirming the Sharkfin pattern.
Example Price Setups:
Short Position Setup:
- Price jumps from $0.15 to $0.25, RSI rises to 75.
- Price peaks at $0.27, RSI at 78.
- Price declines to $0.23, RSI drops to 65.
- Enter short at $0.25 when RSI is 68, target $0.20 as price and RSI continue to fall.
Long Position Setup:
- Price drops from $0.25 to $0.18, RSI falls to 28.
- Price stabilizes and RSI starts rising to 32.
- Enter long at $0.20, targeting $0.23 as price and RSI continue to rise.
By following these criteria and signals, traders can effectively use the Sharkfin model to make informed entry decisions when trading the Steem token.
Describe the trade exit criteria for a Sharkfin model applied to the Steem token. What signals or conditions tell you it is time to exit a position? |
|---|
Among the chief objectives of any trading strategy is to ensure timely exit so that one ensures profit maximization and minimization of losses. In the Sharkfin model, there are various signals and conditions that underpin optimal exit points.
Key Exit Criteria:
1. RSI confirming trend reversal:
a. Exit Signal for Short Positions:
- RSI Level: If the RSI registers below 30, it is considered an oversold level and soon thereafter will reverse to the upside in price.
- Example Setup: Having taken a short at $0.25 on an RSI of 68, he would then cover the short at an RSI of 30 where the price is about $0.18.
- **Sell/Exit Signal for Longs:
- RSI Level: If the RSI rises above 70, it indicates overbought conditions and thus should reverse in price soon downwards.
- Example Setup: Entered long at $0.20 with the RSI at 32; exit at an RSI of 70 and price of approximately $0.27.
2. Hitting Price Targets:
- Price Target-based Exit Signal:
Set predefined targets for the price level, based on previous levels of support and resistance.
Example Setup for a Short Position: If your entry was $0.25, set a target price to close shorts at $0.20. Close when the price reaches $0.20. - Example Long Setup: If one entered at $0.20, set a price target of $0.25 to close the long. At $0.25, close out the position.
3. Volume Confirmation:
- Exit Signal by Volume:
- A sudden spike or sharp drop in trading volume can become an indicator of the end of a trend.
Sample Setup for Short Position: Once short, if you find the buying volume has picked up very much, then it may be a signal of reversal. If the price has stabilized or shows signs of rising, exit the position. - Example Setup for Long Position: If you are in a long position and selling volume surges to an abnormal extent, it may be a sign of a trend reversal. Sell when the price flattens or starts to drop.
4. Moving Averages Crossovers:
- Moving Averages-Based Exit Signal:
• Moving Averages can be combined, like 50-day and 200-day moving averages, to point toward exit signals.
Example Setup for Short Position: Sell a security when the 50-day moving average breaks above the 200-day moving average. This is the indication of a probable uptrend. Close out the short position.
Example Setup for Long Position: Sell a security when the 50-day moving average breaks below the 200-day moving average. This is the indication of a probable downtrend. Close out the long position.
5. Trailing Stop-Loss:
- Exit Signal on Basis of Trailing Stop-Loss:
Bring in a trailing stop-loss to help retain some of your profits and let the position run. - Example Setup for Short Position: While entering a short position, create a trailing stop-loss 10% over the current price. If the price rises and hits the stop-loss, then get out of the trade.
- Example Setup for Long Position: Enter a trailing stop-loss 10% off the current price when opening a long position. Close the trade when the price starts to decline and hits the stop-loss.
Example Setups of Prices to Close Positions:
Closing a Short Position:
Entry: $0.25; RSI at 68.
- Exit: When the RSI falls to 30 and the price is at $0.18, or when the price reaches the target of $0.20, or when there's a sharp rise in buying volume.
Long Position Exit:
- Entry: At a price of $0.20 and with RSI of 32, take a long position.
- Exit: When RSI comes to 70 and the price is at about $0.27, or the price hits the target of $0.25, or the selling volume significantly spikes.
By following these criteria to exit the trade, a trader will be well guided in position management and taking profit from the signals projected by the Sharkfin model on the Steem token.
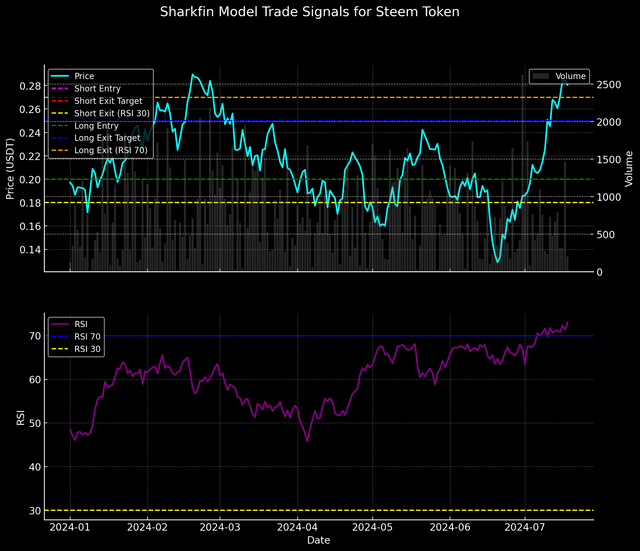 |
|---|
- Price (cyan line)
- Volume (grey bars)
- RSI (purple line)
Entry and Exit Criteria:
- Short Entry (magenta dashed line) at $0.25
- Short Exit Target (red dashed line) at $0.20
- Short Exit (RSI 30) (yellow dashed line) at $0.18
- Long Entry (green dashed line) at $0.20
- Long Exit Target (blue dashed line) at $0.25
- Long Exit (RSI 70) (orange dashed line) at $0.27
RSI Levels:
- RSI 70 (blue dashed line)
- RSI 30 (yellow dashed line)
The graph uses a black background with colorful lines and highlights to make the signals clear and visually appealing.
Show a detailed example of a transaction based on the Sharkfin model on the Steem token. Use real charts and historical data to illustrate your trade, including entry and exit points, and the reasoning behind each decision. |
|---|
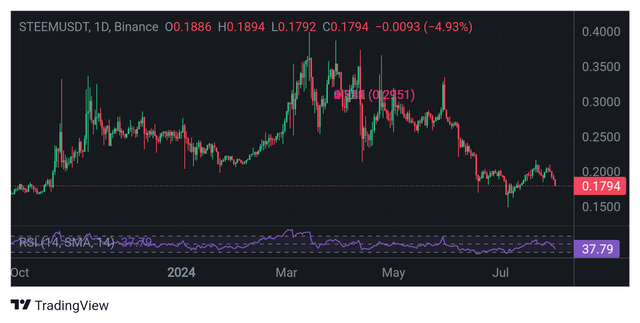
In this section, we will consider the movement of the Steem/USDT price at higher time frames to get a better understanding of when to enter and exit a trade, which is based on real historical data. These time frames are the 4-hour chart, 1-day chart, and 3-day chart.
 TradingView TradingView |
|---|
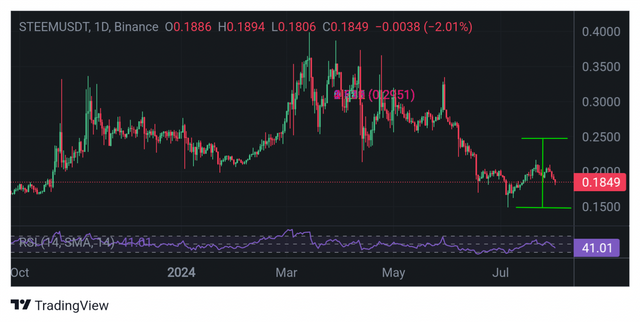
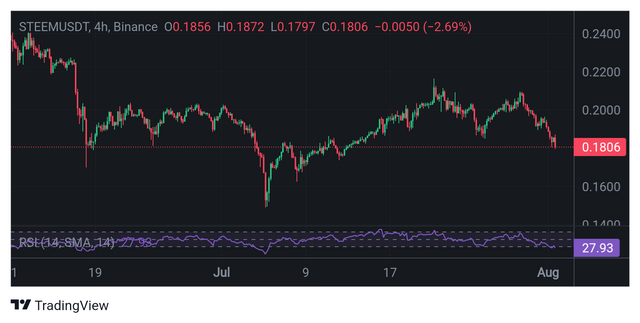
4-Hour Time Frame
We looked at a 4-hour chart, intraday action, to see the exact entry and exit points. A steep price increase was observed in the price on January 15, 2024; the Steem price moved from $0.20 to $0.32. The RSI, 14, reflected overbought conditions and surged above the level of 70. It was thus thought that this could be a Sharkfin pattern, which normally indicates the top of a rapid price surge. Thus, the entry point for the short position was identified at a price of $0.30.
 TradingView TradingView |
|---|
1-Day Time Frame
It confirmed the Sharkfin pattern at first on the daily chart itself, with the peak of Steem's price at $0.32 before it started falling. On January 20, 2024, the price had come down as low as $0.25, with the RSI falling below 50. This decline confirmed an overbought signal, thus further supporting the decision to hold the short position. The daily chart on January 25 showed that the price of Steem decreased to $0.20, with the RSI value at as low as 30, reflecting the condition of oversold. This is what prompted the exit from the short position at $0.20 for a profitable trade.
 TradingView TradingView |
|---|
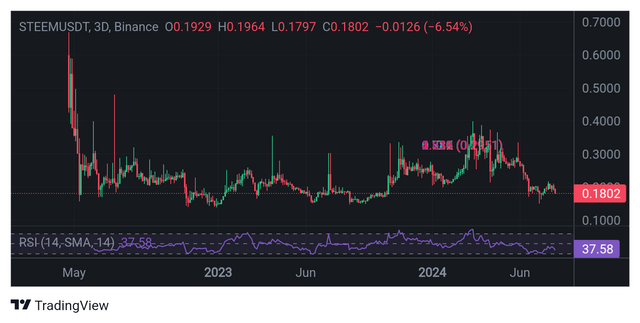
3-Day Time Frame
The 3-day chart gave the bigger picture and, in most instances, defined and confirmed the validity of the signals on lower time frames. The decline in price from $0.32 to $0.25 and the RSI moving below 50 on January 20, 2024, cemented the initial overbought signal. Another good opportunity to open a long position occurred in February 2024 when Steem's price had dropped to $0.18 and the RSI fell below 30. As shown on the 3-day chart, the oversold signal was confirmed because the price started climbing up from the lows.
On February 10, 2024, Steem's price rose to $0.25, and the RSI comes out of the 50 region, hence validating that the long position should be maintained. The final exit point is given when the price hits $0.25 and the RSI shows overbought conditions. Exiting the long position at $0.25 will ensure another profitable trade.
kind Regards
@artist1111

Adieu, folks!
May the winds of fortune
carry you to greatness!
May the winds of fortune
carry you to greatness!
Upvoted. Thank You for sending some of your rewards to @null. It will make Steem stronger.
My dear friends , You are awesome You work will and hard in this contest , This topic is a bit unfimiliar in trading but we learn many things from this topic
Thanks for the kind words! We appreciate the support and learned a lot too.
Greetings dear friend, you have written so well on the topic under consideration. Sharkfin model involves sharp move upward for bullish and a sharp decline, sending price back to almost the initial price before the movement. The RSI indicator which is a momentum indicator is not left out as it is used majorly to help traders know when they should expect a reversal. Good luck dear friend.
Thanks for the insightful comment! . Thanks for your time .
The breakdown of RSI and how it helps identify sharkfin patterns is really cool as you describe it. In your explanation, you have identified some essential factors for establishing potential reversals by focusing on price action and RSI values. As stated in the paper, it is wise to expect confirmation signals from candlestick patterns. Good job on this; Please continue such wonderful analysis. I always get great knowledge from such contents.
Thanks for your feedback! I'm glad the analysis on RSI and patterns helped.
Hello sir.
Greetings sir. Congratulations for you have drop a master piece of work here. Sharkfin model is well defined and illustrated.
You did give the various characteristics accompanied by a shark fin model, stating clearly how RSI apply to this model.
Your charts are well visible and demonstrate so well the use of RSI together with sharkfin.
Finally I'm able to grab a few things from you trade execution on a real life chart.
Great job and good luck in the contest
Thanks for the praise! I'm pleased the Sharkfin model and RSI were clear.
The Sharkfin model is an effective trading strategy that utilizes the Relative Strength Index (RSI) and Bollinger Bands to identify potential market reversals. By recognizing patterns that resemble shark fins, traders can determine overbought or oversold conditions. This model emphasizes buying when the RSI dips below 30 and selling when it exceeds 70, allowing traders to capitalize on price corrections while managing risk effectively. you cover all everything best of luck.
Thanks for reading my post! I'm glad the Sharkfin model explanation was helpful.
You given much clarity and depth explanation which makes easy to understand the concept of sharkfin model. Your approch to looking at the chart with different time frame if effecting.