Steemit Crypto Academy Contest / S18W4: Mastering Liquidity Levels in Trading
Hello everyone! I hope you are all doing well and enjoying life with the blessings of Allah Almighty. I am happy to take part in the exciting challenge hosted by SteemitCryptoAcademy community . So, without any further delay, let's dive right in! Shall we ? ........, Okay , Okay😊! .
Describe the concept of liquidity levels in trading. Why are they important for traders? |
|---|
Liquidity in trading we often hear once and nit twice but many time means how easily you can buy or sell an asset without changing its price too much. Comparable to attempting to market stuff at a garage sale, you can move efficiently and for a decent price if a lot of people are interested. To sell it, though, that you might need to significantly reduce the price if no one is interested. In the financial markets, excellent liquidity indicates straightforward trade while low liquidity indicates more difficult and costly trading.
Why does liquidity matter for traders? It all comes down to efficiently entering and exiting deals. You can buy them or sell assets like stocks or currencies quickly and without having spent time waiting around or pay unnecessarily in a highly liquid market.
This is crucial because, by helping traders manage their assets well, it diminishes the likelihood that they could forfeit money when they try to trade due to market changes. The main advantage is that it makes the market more predictable and predictable, which is good for everyone looking to make money.
Liquidity is influenced by several things. First, trading volume is important; markets with a high volume of deals daily are typically more liquid. Another crucial factor is market depth, which shows the abundance of buy and sell orders at different price points.
It's important to consider the type of commodity as well; well-known assets, such as large companies and currencies, tend to be more liquid than uncommon ones, such as bonds from municipalities or small-cap stocks. Liquidity is also impacted by political and economic situations, which have an effect on investors' the levels of trust and investment decisions.
A price chart's liquidity levels can be ascertained through the use of various indicators such as volume, the bid-ask spread, and the Depth of Market (DOM). Volume can be used to gauge the level of market activity since it shows the number of shares that or contracts were exchanged over a given time period.
Great volume denotes great liquidity, which makes it possible deals to be easily completed without causing noticeable fluctuations in price. The difference between the greatest price a buyer is ready to pay and the lowest price a seller is willing to agree to is measured by the bid-ask spread.
Whereas a broad spread denotes reduced liquidity, a small difference shows higher liquidity. A snapshot of buy and sell orders at various price points is provided by DOM, illustrating the depth that the marketplace offers as well as possible levels of support and resistance.
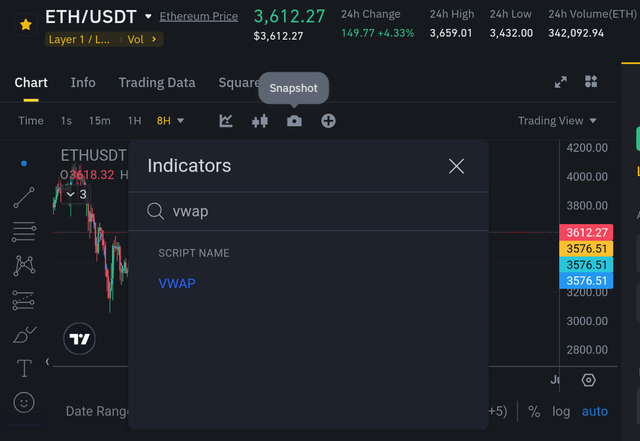
For a more practical and clear overview, the VWAP indicator is particularly useful.To find the VWAP indicator in TradingView, follow these steps.
 TradingView TradingView |
|---|
First, open your TradingView account and select the chart of the asset you want to analyze. In the upper menu, click on "Indicators" and type "VWAP" in the search bar.
 TradingView TradingView |
|---|
Choose the VWAP indicator from the list that appears. Once the VWAP is applied to your chart, it will display a line that represents the average price of the asset, weighted by volume.
This line helps you see where most of the trading activity is concentrated, indicating areas of high liquidity. This can guide your decisions on entering or exiting trades more effectively.
.png) Liquidity Index Liquidity Index |
|---|
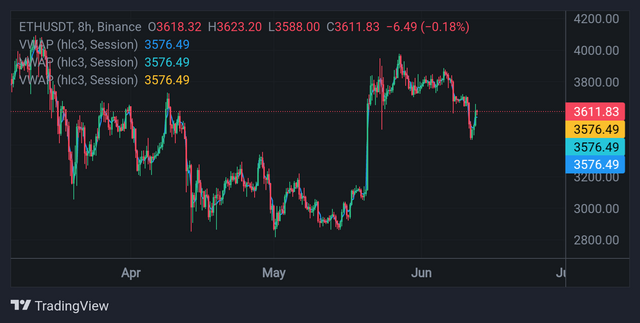
Let suppose, the chart above shows the Ethereum (ETHUSDT) price on an 8-hour timeframe, with multiple VWAP (Volume Weighted Average Price) lines and a Volatility Index.
The VWAP lines, all around 3576.66, indicate areas where trading volume is concentrated, suggesting significant liquidity at these levels. The price currently at 3615.55 is slightly above the VWAP, indicating a potential resistance level.
The Volatility Index at 3612.05 suggests moderate market volatility. This setup can help traders identify potential entry and exit points based on liquidity.
What is a fakeout in the context of liquidity levels? Explain why and how traders are often trapped by fakeouts. |
|---|
A fakeout occurs when the price of an asset temporarily moves above a resistance level or below a support level, giving the false impression that a breakout has happened. Due to this, traders may be duped into making trades in the direction from the alleged breakout. But the price immediately turns downward and returns to the earlier range.
- Why and How Traders Are Often Trapped by Fakeouts
Fakeouts frequently trap traders because they primarily depend on technical levels in the hopes that a breakout will result in a long-term price movement. Bigger players in the market, nevertheless can take advantage of this anticipation.
 TradingView TradingView |
|---|
- ETHUSDT Chart Analysis
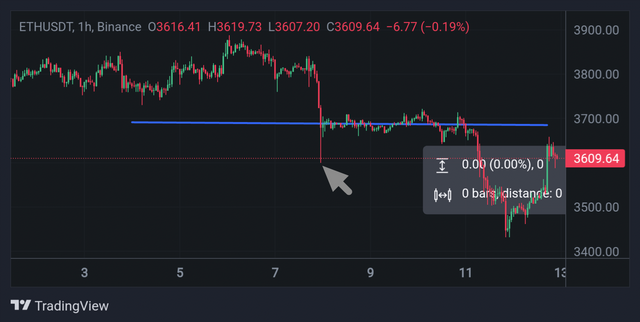
In the ETHUSDT chart, we observe a significant fakeout on June 8th. The price started at around 3680 and dropped sharply below the blue VWAP line to a low of approximately 3500. This move likely induced many traders to enter short positions, anticipating a further decline.
However, the price quickly reversed back above 3550, trapping those who had shorted the market. The quick rebound caught traders off guard, forcing them to cover their positions at a loss as the price stabilized around the 3600 level.
 Trading View Trading View |
|---|
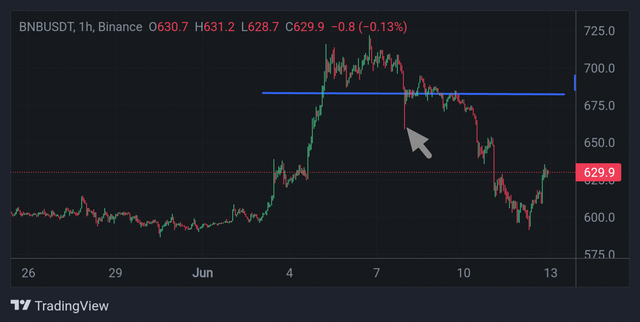
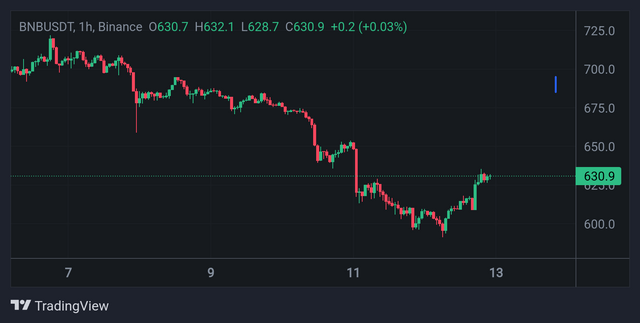
- BNBBUSD Chart Analysis
A similar fakeout was seen in the BNBBUSD chart around June 8. The price broke through the VWAP line, falling from roughly 690 to a low of about 625. This was probably taken by traders as a bearish signal, leading them to initiate short positions. But the price swiftly deteriorated around, rising above 650 once more and ultimately approaching 675.
The traders who had shorted the asset were caught by this quickly reversal, and suffered losses as they rushed to get out of their positions.
In both scenarios, temporary liquidity was produced by using fakeouts for triggering off stop-loss orders that have been placed just above critical levels. Bigger players entered positions at favourable prices, taking advantage of this. Traders should wait for additional confirmation, like persistent volume or continuation.
price action, before moving on a perceived breakout in order to avoid becoming caught off guard by fakeouts. This lessens the possibility of falling victim to a deceptive movement planned by bigger market players.
Describe an effective strategy for trading liquidity levels correctly. What signs or confirmations should traders look for before taking a position based on a liquidity level? |
|---|
Effective trading of liquidity levels requires knowing where and how liquidity is concentrated on the price chart in order to make well-informed trading decisions. This technique may be seen in action by analyzing the 1-hour timeframe chart for BNBBUSD that is provided. Determine the critical levels of support and resistance where liquidity typically congregates first.
 TradingView TradingView |
|---|
The price recently fell significantly to about 625 on the chart, but it rapidly rose again. Due to large buy orders that opposed the selling pressure and caused the price to invert, this sector shows great liquidity. These areas are essential for establishing trades.
Before opening a position, traders should seek confirmations in order to avoid fakeouts. A robust recovery as well as several retests of the liquidity level without a substantial breach consists of two useful indicators. For example, the price signaled a possible support level with significant liquidity after falling to 625 and rising again. Here, waiting for the price to approach this 625 level once more and more watching its movement might be a wise course of action. It would be a good idea to open a long position if the price begins to hold, exhibiting considerable buying activity and less selling pressure.
On the other hand, there may be a chance to short the market if the price confronts a resistance level with the ground, like the most recent high of 675, and appears to be having difficulty breaking through.
Looking to the above BNBBUSD chart, a long position would have been possible at the 625 reversal point due to the fact that it showed a liquidity trap in which buyers intervened and drove prices back up to 630. Before making an investment, a careful trader would wait for confirmation—a large bullish candle or higher volume, for example—to make sure the move is real as opposed to a fakeout.
What are some tips and techniques to avoid fakeouts when using a trading strategy based on liquidity levels? Give a concrete example with detailed steps. |
|---|
When using an investment approach based on liquidity levels, traders should employ a number of tricks and methods such as including as volume research, multi-timeframe analysis, and confirmations, to prevent fakeouts.
.webp) Example Graph Example Graph |
|---|
Here is a thorough presentation utilizing the TRX/USDT trading pair:
Confirmations: Never make a trade before acquiring more confirmation. A second candlestick chart closing above or below the breakout level is a potential way to confirm this, as is utilizing technical indicators like the Volume Weighted Average of Price (VWAP). Take note of the price oscillations around the mean VWAP line in the shown TRX/USDT chart. A rapid recovery could point to a fakeout, while a breakout above the VWAP with continuing strong volume could indicate a real advance.
Volume Analysis: When a breakout coincides with through high trade volume, it is highly suggestive that the move is real. The green volume line across the chart indicates trading activity. There is less chance of a fakeout if the price rises above the VWAP and volume sharply improves. This indicates considerable interest from the marketplace. On the other hand, exercise caution since this might not be a sustainable increase whenever the price breaches a level but the volume stays low.
Multi-timeframe Analysis: Examine many time periods for the purpose to comprehend general patterns and liquidity levels. For example, look for confirmation on the 4-hour or daily chart if you see the breakout on the 1-hour chart. This aids in the omission of misleading signals and noise.
.webp) Example Graph, Practical implication Example Graph, Practical implication |
|---|
Using these techniques, let’s say you observe TRX/USDT breaking above a resistance level at $0.10 with increasing volume on the chart. You also see the VWAP line (in red) providing support, which reinforces the breakout. You might enter a long position at $0.105 with a stop-loss at $0.095. Monitoring volume, if the price and volume continue to rise, you stay in the trade. If the volume drops and the price falls back below $0.10, this indicates a potential fakeout, prompting you to exit the trade to minimize losses.
By using these strategies, traders can make more educated as well as calculated trading decisions by navigating the liquidity ecosystem more skillfully and avoiding fakeout traps.
Analyze a chart of a crypto asset of your choice, including the Steem token, to identify liquidity levels. Describe a potential trade based on these levels by explaining your reasoning and the steps you would take to enter and exit the position. |
|---|
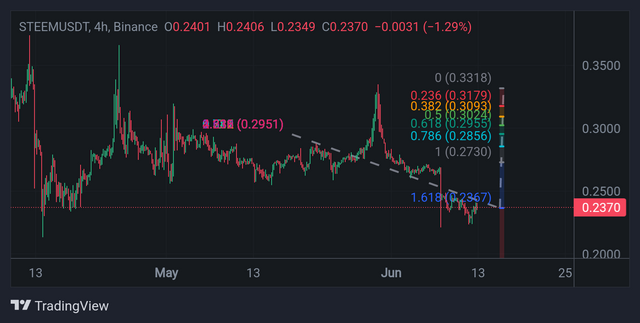
The chart provided for STEEM/USDT on Binance depicts a 4-hour time frame analysis. The Fibonacci retracement levels and some key support and resistance levels are already marked on the chart, which will be essential for our analysis.
 Fib Extension Fib Extension |
|---|
Liquidity Levels Analysis
The price action shows a distinct downtrend with periodic rallies, indicating potential liquidity pockets at certain levels. The Fibonacci retracement tool highlights significant levels that can act as support or resistance. Key Fibonacci levels are:
- 0.236 (0.3179)
- 0.382 (0.3093)
- 0.5 (0.3024)
- 0.618 (0.2955)
- 0.786 (0.2856)
Additionally, the most recent low around 0.2367 and high near 0.3318 also play critical roles. The current price is around 0.2370, slightly above the 1.618 Fibonacci extension level of 0.2367, suggesting that this level is a significant support.
Potential Trade Setup
Long Position
Given that the price is hovering near the 1.618 Fibonacci extension level, which typically acts as a strong support in an oversold market, a potential long position could be initiated here.
Entry Point:
- Enter at or near the current price level of 0.2370.
Stop Loss:
- Place a stop loss slightly below the recent support level to avoid being stopped out by a small price fluctuation. A stop loss at 0.2300 would be prudent.
Take Profit:
- First take profit target would be the 0.236 Fibonacci retracement level at 0.3179.
- A second take profit target could be set at the 0.382 Fibonacci level at 0.3093.
Risk Management:
- Ensure the risk-to-reward ratio is favorable, ideally aiming for a 1:3 ratio. This means risking about 0.007 points (from 0.2370 to 0.2300) to gain about 0.0809 points (from 0.2370 to 0.3179).
Reasoning
The reasoning behind this trade setup includes the following:
- Support Level: The 1.618 Fibonacci extension at 0.2367 is a strong support level, and the price is currently just above it, indicating a potential bounce.
- Fibonacci Retracement Levels: The retracement levels identified are often areas where price action tends to react, making them good targets for profit-taking.
- Oversold Conditions: The recent sharp drop to the 1.618 level might indicate oversold conditions, &potentially leading to a corrective rally.
Trade Execution Steps:
- Monitor the Price: Watch for a confirmation of support around the 0.2370 level, such as a bullish candlestick pattern or increasing buying volume.
- Enter the Trade: If confirmed, enter the trade at 0.2370.
- Set Stop Loss and Take Profit Orders: Immediately set your stop loss at 0.2300 & take profit orders at 0.3179 and 0.3093.
- Adjust as Needed: If the price moves in your favor,
& consider adjusting the stop loss to break even once the price reaches halfway to the first take profit level.
This method creates a structured and risk-managed trading plan through the application of fundamental market analysis principles, with a focus on Fibonacci retracement, extension levels, and liquidity levels.
kind Regards
@artist1111

Adieu, folks!
May the winds of fortune
carry you to greatness!
May the winds of fortune
carry you to greatness!
Upvoted. Thank You for sending some of your rewards to @null. It will make Steem stronger.
TEAM 7
Congratulations! Your post has been upvoted through steemcurator09.Well said that the Bigger players entered and take advantage, they does not wait for long points achive, they just entered and sell immidiately with some % profit due to which the price get high volatility and then pump - dump. In this a retail traders get trapped.
Thanks for reading my post! Indeed, big players often cause market volatility, trapping retail traders.
@artist1111 I appreciate how you broke down the concept making it easy to understand why high liquidity is crucial for entering and exiting trades efficiently. The use of indicator like volume bid ask spread and VWAP for identifying these levels on chart is particularly insightful. Your analysis of fakeouts and strategies to avoid them is very helpful too. Good luck
Thanks for reading my post! Glad you found the strategies helpful!
I read your post your post is really informative and interesting because you explain all points briefly. I have also participated in it because it's interesting contest..
Best wishes 💞
Thanks for reading my post! Best of luck in the contest!
Mastering and Liquor levels are very nicely presented and drawn in total in screenshots that are informative and effective. It is really important for cadres to learn from big losses and gain market knowledge and exit the market on time. Thank you very much for sharing. Best of luck.
Thanks for reading my post! Glad you found the screenshots effective!
Greetings @artist1111,
I like how you explained why it's important to have a lot of trading activity to enter and exit trades smoothly. Using tools like volume, bid-ask spread, and VWAP to spot these levels on charts is really smart. Your tips on spotting fakeouts and how to steer clear of them are super useful too. Best of luck with everything.
Excelente post amigo, muy completo y aporta grandes conocimientos y dominio del tema.
Saludos y que sigan tus éxitos.