Candlestick Patterns - Steemit Crypto Academy Season 04 - Homework Post for Task 10
Homework Task 10
1.a)Explain the Japanese Candlestick Chart? (Original Screenshot required).
b)In your own words,Explain why the Japanese Candlestick Chart is the most used in the financial market.
c)Describe a bullish and a bearish candle. Also, explain it's anatomy. (Original screenshot required)
1.a)Explain the Japanese Candlestick Chart? (Original Screenshot required).
The Japanese candlestick chart is a graphical representation of an asset price for each period. It is a tool developed by a rice farmer named Munehisa Homma. That is, this price movement consists of everything from open price, highest price, closing price and lowest price.
🔹By open price, the candlestick chart represents its starting point. In a bullish pattern, it tends to move in a positive direction, while in a bearish pattern it tends to fall.
🔹Highest price indicates the highest value recorded in the chart.
🔹The lowest price indicates the lowest value of assets in a given time frame.
🔹Closing price indicates the final price of a quote. This marks the end of the candle.
This graphically shows the interaction between buyers and sellers.
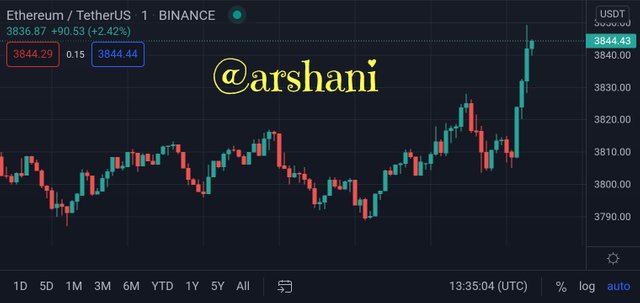
Original Screenshot taken from https://www.tradingview.com/
The picture I uploaded above shows a candlestick chart for ETH / USDT. This candlestick gives you clues as to when to enter the market to minimize losses. Understanding how to read these tools will help a trader make good trading decisions.
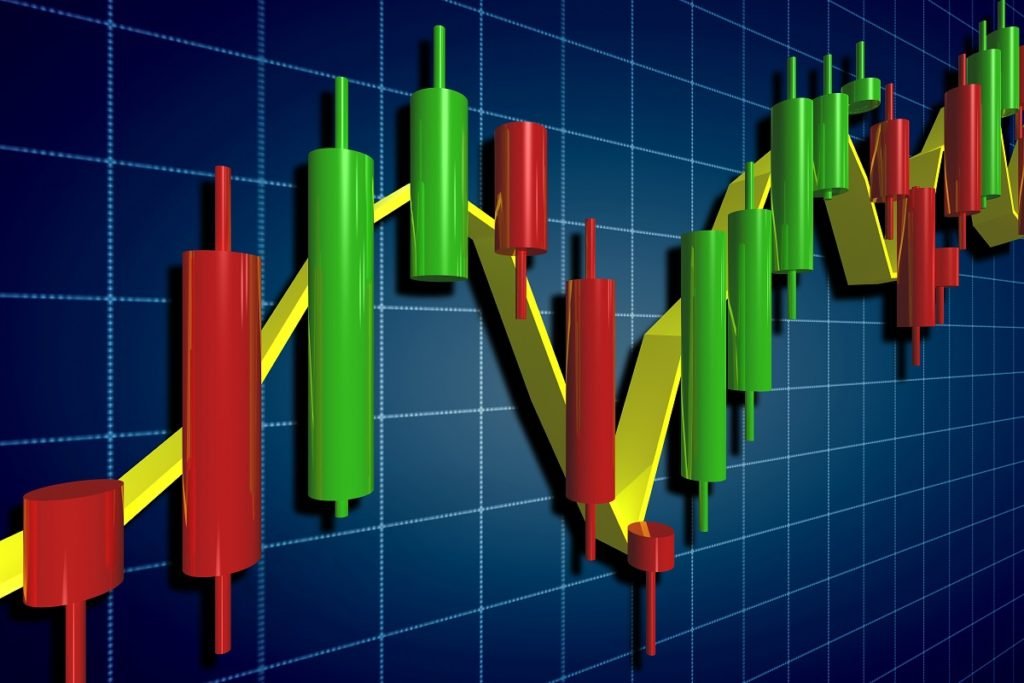
b)In your own words,Explain why the Japanese Candlestick Chart is the most used in the financial market.

In today's world, Japanese candlestick chart is a popular method of industrial analysis. This visually provides a lot of information and clearly shows the highest and lowest point in the market, the starting price and the closing price.
Also, Japanese candlestick patterns can be used to track previous market movements as well as clues as to where the market is heading next. They are listed as easily identifiable formats. This can benefit cryptocurrency traders. These candles can be used to test the pricing process in any time frame, from as little as a second to a year. The market is well represented by the use of two colors of red and green.
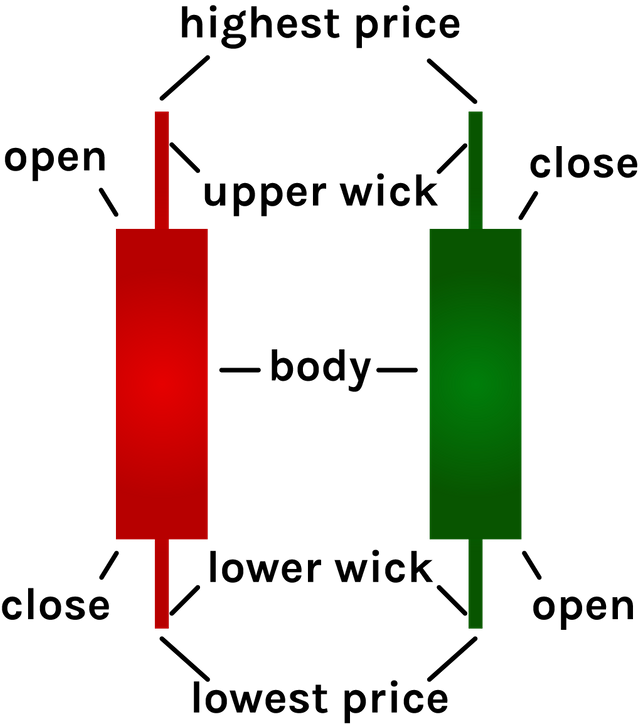
c)Describe a bullish and a bearish candle. Also, explain it's anatomy. (Original screenshot required)
Bullish candlestick and Bearish candlestick can be described as two types of candles that help to buy stock or financial assets in the market. Such candles consist of elements such as high price, low price, real body, close price, upper shadow and lower shadow.
Bullish Candlestick
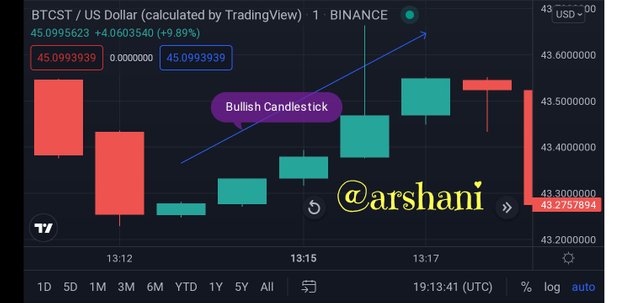
Original Screenshot taken from https://www.tradingview.com/
Bullish candlesticks are usually represented in green colour or white colour candlestick. This is what the chart looks like when buyers control prices. That is, bullish candles make us aware of buyers. This candle pattern informs the sellers that the market is on a high trend after the previous price reduction. In such a case the market can make a profit and the trader can sell most of his assets. In order to make better trade decisions we need to know who has the most power when it comes to trading.
Bearish Candlestick
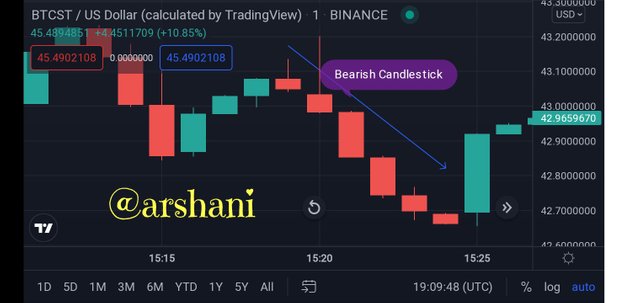
Original Screenshot taken from https://www.tradingview.com/
This type of candle is represented in red on the chart and can also be changed to black if desired. The graph shows the bearish candlestick as the movement of several candlesticks decreases in sequence. This shows a decrease in the price of an asset in the market. This shows that the sellers have controlled the price. In such a case it is advisable to withdraw from the market to minimize the losses incurred by the market.
While studying this homework, I gained a understanding of how to read the Japanese Candlestick Chart, and the article by the professor @reminiscence01 who prepared this homework was very helpful to me.
#club5050 😀
#club5050 😃 It was a program that encouraged me. Thank you so much for your support!
😢🥲🥺