Steemit Crypto Academy – Season 2 - Week 7 - Submission of homework post on swing trading for @yohan2on by @arrowgate
Greetings to all dear steemit fellows and to you Respected sir @yohan2on
Before starting my homework task let me tell you that I am your new student 🙂
And I am doing very first time any homework,and here I'll explain in very easy and simple wordings about THE SWING TRADING STYLE
Let me more tell you Respected professor that I'll do my all the best to give 100% on my life's very 1st homework, as you know all of you best beginning can give you more courage and support so no matters how much it takes time to complete my this homework I'll give it my all the best to make my ever first homework fine.
So Let's start.
SWING TRADING.
So to be honestly it was very new to me and I wasn't enough we'll known to it as before I started reading Respected professor Lecture very carefully I tried to read it as clearly as possible and what I observed that according to professor's lecture traders (peoples) can see the technical analysis to do trading easily.
SWING Trading is basically a style of trading with in the cryptocurrency market in which a cryptocurrency trader holds a trading position for several days or weeks in order to capitalize and profit from swings or market changes,means Swing trading technique is the method of holding a position for a long period of time it includes days ,weeks or months.
This is a trading style in which traders earn small size or medium size profit.
According to my observation as I observed that SWING TRADING is easy to use for trades for it you should have little knowledge because sudden changes in the market movement in reversal can lead to you to loss that's why I earlier mentioned that for this you have little knowledge for it.
As you are very well known that the cryptocurrency market doesn't moves in only one direction rather it moves in one direction to another in which it becomes very beneficial to a swing trader to get enough profit from the market movements and it's chages.
My Trading Plan | SWING TRADING BY USING UNI/USDT pair
So by doing practically I'll be using the **UNI/USDT Pairs. As earlier I mentioned that SWING TRADING is the style of trading in which traders holding a position for several days it even for weeks in order to get enough profit and advantage of market changes or swings.
if I explain in more easy wordings then it will be like that, In swing trading the traders uses technical analysis to identify possible sell and buy positions.
So as my heading is about using ***UNI/USDT Pairs for this demonstration because to be very honest in explaining I feel it very easy and simple.
What's your Entry and exit strategy?
As according to me for any trading make it very clearly and it is very necessary and important to have a clear trading strategy, and you should know rules and regulations if this trading style very well before stepping into this trading style in order to get enough profit, further let me explain you more.
This kind of Trading style is great for swing traders as because they can take high advantage of these market swings to make good profit,in which technical analysis indicator is also very important when it comes to swing trading you can say that it also plays keen role in order to make good profit.
As for my Entry and Exit Strategy I'll be using analysis Indicators to determine my entry position.In this I'll explain these analysis Indicators that how we can use them in order to make good profit and how they works and how you will learn of using it. I'll use these analysis Indicators that can enable me in identifying the current and possible swing trade.
As I earlier mentioned that this analysis Indicators I feel is easy to use so here I am starting by doing practically,so I'll use the combination of Relative Strength index ***RSI & the 5EMA & 10EMA to make my entry and exit positions.
As it's very easy and simple to use.
This Rsi would help me determine the oversold and overbought positions to make and follow the best trading strategy decisions and plans with less risk.As using the RSI I checked out for oversold and overbought signals on this RSI chart,as when the value of the RSI is below the 30 line I'll consider it as oversold that indicates a buy or entry signal, and if when the Rsi crosses the 30 line and above the 70 line then it indicates a sell or exit signal.
So I'll wait for the RSI to cross the 30 line as an Entry signals and if above then I'll wait for my exit signals. Same way I'll use to like 5EMA & 10EMA so when 5EMA line crosses the 10EMA line I'll will indicates the overbought signals and when the 10EMA line will cross the 5EMA line it will indicates and confirms that oversold signal.its just little tricky but not difficult to understand.
MULTIPLE TIME FRAME ANALYSIS.
So here let me explain you more in easy wordings that when it comes to technical analysis multiple time frame analysis is very important.
basically it means when s Cryptocurrency trader utilizes technical analysis monitor or check a particular cryptocurrency pair on different time frames so to know the exact direction of the market and to order to make the best trading strategy decisions and plans.
As it is very important and beneficial because cryptocurrency trader can determine the price of the cryptocurrency pair on different points at time in which it will allow the trader to have a general idea of market trend and it's direction as he will observe that if cryptocurrency has been going DOWNTREND he will be well known his this strategy and get benefit by knowing exactly the good price of particular cryptocurrency.
More over let me also share information about types of several trends and those are UPTREND,DOWNTRENDS & HORIZONTALTRENDS etc
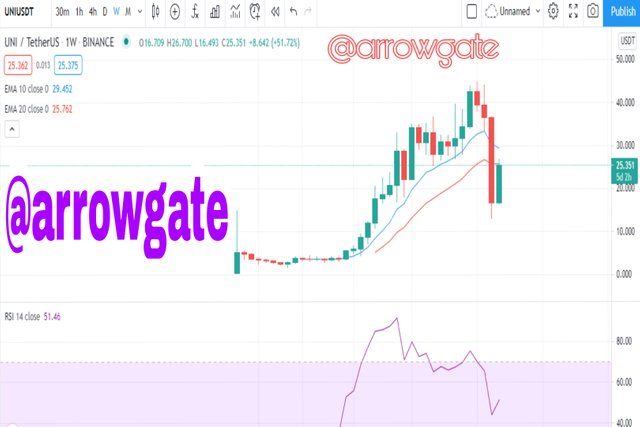
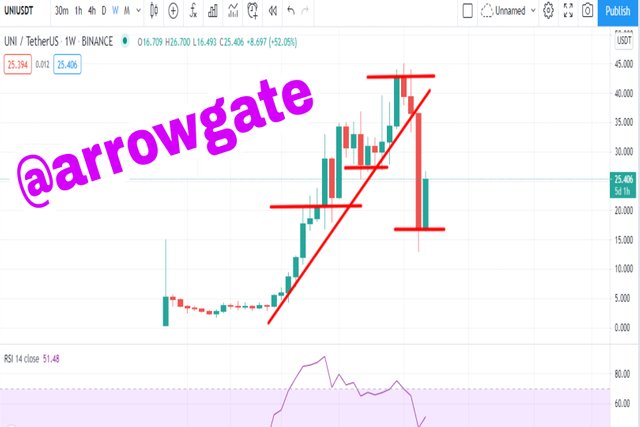
WEEK CHART ON UNI/USDT Pair
As shown in chart below , the chart of the UNI/USDT Pair and using RSO along with 10EMA AND 20EMA.
As you can see that the price is below direction the market is going. The current weekly chart shows that the price is below the moving averages that would suggests that the market is moving in an downtrend direction. The 10 EMA is above the 20EMA which shows that the market movement is in an uptrend direction. RSI indicator shows the overbought regions and the regions where the market is in the middle, you can clearly see chart given below.
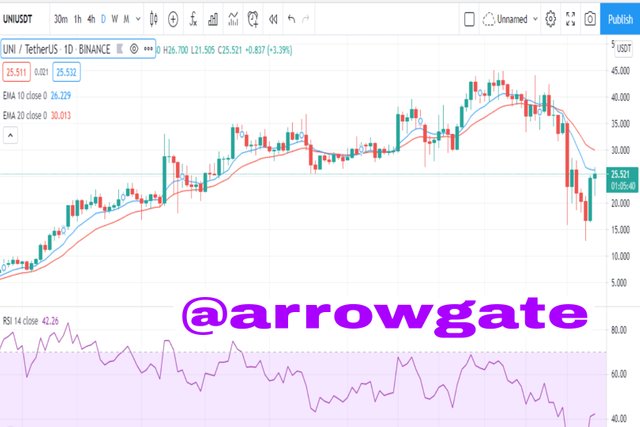
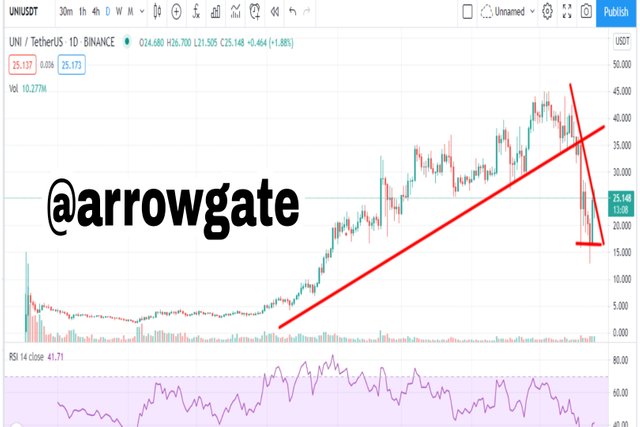
Daily CHART On UNI/USDT PAIR.
Here now move to daily chaty on UNI/USDT as you can see the daily chart of the UNI/USDT pair and using the 10EMA, 20EMA and RSI, you can as well see the market trend direction,that what actual direction it is showing us The current daily candles shows that the market is below the EMA lines and it still shows that the market is still moving in a DOWNTRENDS and trying to move above the moving averages.So that the RSI confirms the market trend as the recent RSI has gone below the 30 line. As for considering to me this is a great time to buy and hold and wait for the candle sticks to cross above the EMA lines or the RSI to move closer to the 70 line or above the 70 line, simply as shown in chart given below and as earlier I mentioned that is little bit tricky to understand but not difficult to trade on it.
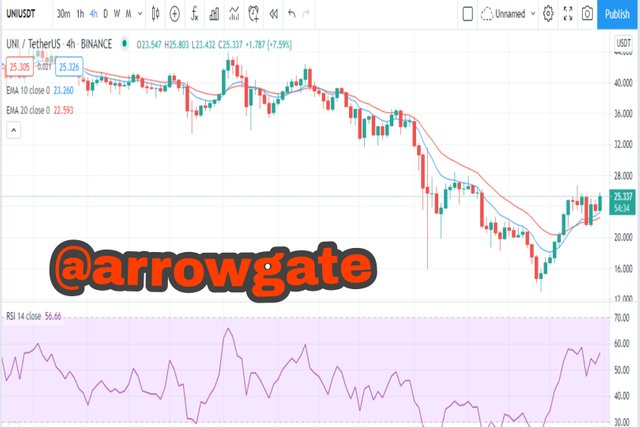
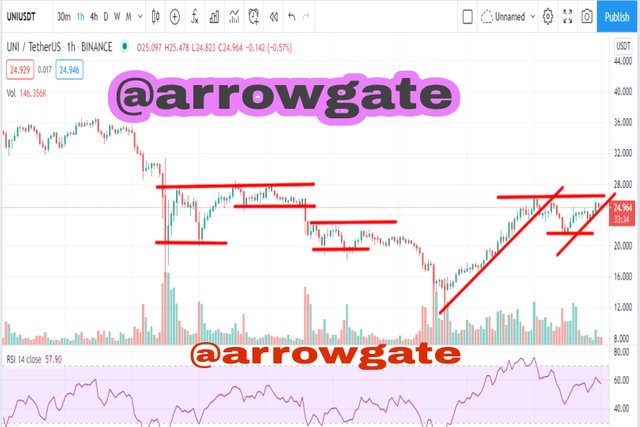
4 Hour Chart On Uni/usdt Pair.
After observing and highlighting daily chart that how that chart work and traders can follow daily chart to get profit so now I'll highlight The 4 Hour chart of the UNI/USDT pair and using the 10EMA, 20EMA and RSI shows the market trend directions. The 4 hour chart and candles also shows the different support and resistance levels, and also it indicating the various entry and exit points. Observing at the chart, you can clearly see that the candles are above the EMA lines and the RSI is getting enough closer to the 70 line.So that suggests a good entry point, as same where you observed exit pont and here you will well-known to entry point.
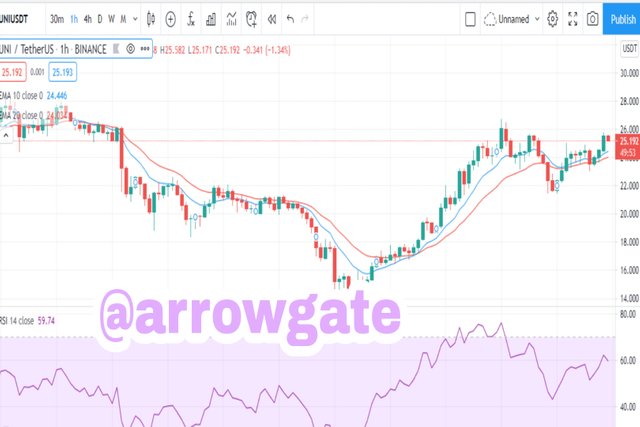
1 HOUR CHART ON UNI/USDT PAIR.
So after simple readings on 4 hour chart now lee are here on the 1 Hour chart of the UNI/USDT pair which is enough similar to the 4-Hour candles. In this the price candles are staying above the EMA lines,and moreover 10EMA line is above the 20EMA line which indicates that the market is moving in an UPTREND direction that is also confirmed by the RSI. Here you can also see the different supports and resistance levels if you observe it with attention then you will clearly see the resistance levels.
CANDLESTICK ANALYSIS and use of other relevant supporting indicators for your trade decision
So here is another important task given by Professor @yohan2on about candle analysis and use of other relevant supporting indicators for our trade decision. So for this simply, I will like to use the weekly timeframe candles. Just looking at the weekly candles of UNI you can easily see the different price points and trend movements in a chart as Using the volume indicator, you can also see that the volume of UNI has been on the DOWNTREND. Going back to 2 or 3 months ago, we can see that UNI has crossed it previous all-time highs. Its first serious all-time high was around $5.534 before reaching a current new all-time high of $42.603. Recently as you can clearly see the difference and, UNI has been in a BEARISH trend, but is trying to break above the previous support level. If this happens, then we can see UNI reaching or breaking above its previous supporting resistance level.
As you have seen that the daily candles shows that the price of UNI on the USDT pair has been in an UPTREND direction before taking a correction and moving in a DOWNTREND recently. so from the volume indicator, you can clearly see that the trading volume of UNI has dropped as well. The RSI chart is showing the different overbought and oversold positions. (As i mentioned earlier to know about oversold and overbought) The currently UNI is being slowly bought as it is trying to recover. UNI wedged a support at $16.625. Currently the price is sitting around $25 as it is trying to bounce and recover back to its previous highs I means to it's previous price. The RSI is showing that the price has left the downtrend and is trying to move to an uptrend direction, In simple words as it is shifting it's positionfrom DOWNTREND to *UPTREND.
So in the 1 hour candle shows the hourly trend of UNI. UNI has been moving in an uptrend direction as you can see it very clearly in 1 hour candle chart .it is doing correction and is recovering and trying to break out from its previous highs. The RSI signal is showing an uptrend as seen movement which for me is a buy signal, I means Entry signals. it is a really good time to enter the market as there is a very strong chance that UNI would reach or overtake its previous highs,and you can gain enough profit.
TRADE MANAGEMENT.
So we are moved to another task given by Respected professor @yohan2on so let's put some highlights and I'll try to explain it my own easy wordings. So when it comes to trading any cryptocurrency asset, it is very important to make use of risk management strategies in order to minimize risk or avoid of getting risk in a highly volatile cryptocurrency market. In short it means that you should made a good trading strategy to cover all risky strategy that may put you in risk so in order to avoid from getting risk,your strategy should be clear and strong.so here for me, I will enter UNI at $24.25, set a stop loss at slightly below the previous support level at $23.10, I will also set the trailing stop at 23.18 and will set a sell order when the price reaches $28.50 to take profit, that means by earning good profit I'll take step to reduce risk as possible as I can do, it's not difficult but you have to be very sharp in this strategy to reduce risk as possible as you can do your bests.
MY CONCLUSION.
According to my reading and observations I had a now great experience about it, but to be honest as all of you know very clearly that the market isn't constant,that means it's changes it's directions from time to time, so everyone knows that sometimes market goes in your favor and sometimes it puts you in alot trouble yes I mean it totally goes against to your favor so in order to avoid from all these situations we have to well know that when we should enter in it and how to apply good strategy in order to earn good profit without getting too much risk, and One thing more that when ever you are in trading then make it sure your are observing your trading by time to time and stick to a trading strategy in order to get more focused on your trading to minimize risk as possible as you can do your best, your best plans decision on time and strong strategy will off course leads you to the profit.
At the end of my very first submission of Homework I'll specifically thanks to our Respected Professor @yohan2on for wonderful lecture.Yes I'll further keep attending all lectures, as this was my 1st home work so I'll request to Respected Professor to review my Home work. I am hoping for the best !
Regards your New Student @arrowgate Thanks !
Hi @arrowgate
Thanks for participating in the Steemit Crypto Academy
Feedback
Too many words used with a less practical demonstration of the swing trading style. This was more of a practical homework task. You did not have a clear trading plan.
Homework task
3
Thank you Respected professor @yohan2on no problem I learned alot from this and I do believe sometimes you win sometimes you learn and no matter I couldn't clear it but I learned alot thanks again !