Highly profitable Trading Strategy with VuManChu Cipher B-steemit Crypto Academy |s5w6|Homework post for @reddileep
Question 1: Define VuManChu Cipher B Indicator in your own words

VuManChu Cipher B Indicator is a technical indicator that is derived and modified from the Market Cipher B indicator, that comprises of several indicators such as Money flow, momentum, market volume as well as the Relative index indicator (RSI) that is used by technical analysts to get information relating to the rate at which money flows in and out of the market, as well as when to exit or enter a market. It is quite a unique indicator as it can help traders make a good decision when it comes to predicting as well as telling how the price of an asset will go in the future.
The indicator is not for beginners, as it seems to be very complex, but with modifications on it, it can be used as a good trading indicator. With a combination of the indicators listed above, it is possible to know the direction with which the price of an asset is going just by knowing the price action. In simple terms, the VuManChu cipher B indicator works in relation to the principle of demand and supply. I.e, when there is an increase in the rate at which an asset is bought, the demand tends to increase as well as the price of that asset., also when there is an increase in the rate at which assets are sold, the supply will also increase but there will be a reduction in the price of that asset.
The principle of the VuManChu indicator is quite easy to understand, as it makes use of wave lines that hover around the asset, and are used to depict the in and outflow of money, of the market. The wave lines are also made of dots that could either be red or green depending on whether the buyers or the sellers are in control of the price of the market. This indicator is available for use in the trading view platform.
Question 2: How to customize the VuManChu Cipher B Indicator according to our requirements?
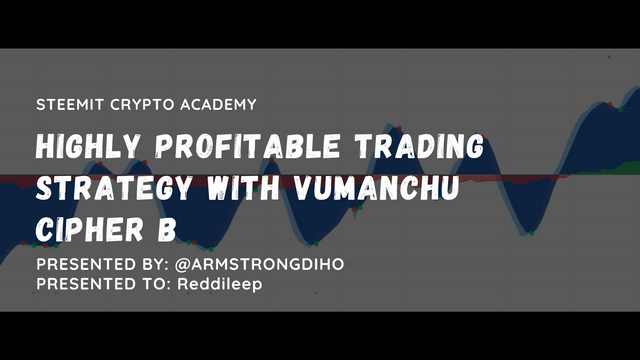
To customize the VuManChu Cipher B Indicator, let's start by adding it to our chart. To do this, visit your exchange or simply go to TradingView, select your asset of choice, and apply the indicator by searching for VuManChu Cipher B Indicator in the indicator tab area. This is the first and simple process, to begin with, here is a graphical representation:
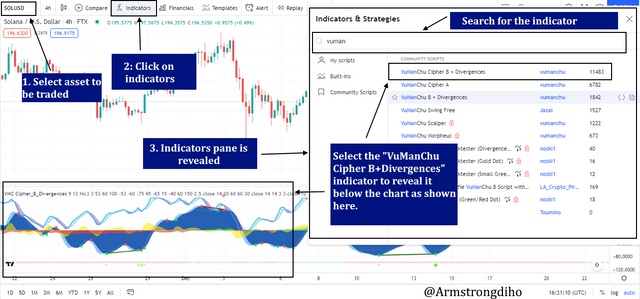
Next, we can customize the indicator with a few simple steps. First, click on the indicator to reveal these simple additional dialogue menus just above it,  , next, select the settings option represented by this icon
  to access a wide range of customization options shown below:
From the chart above, there's no doubt that we have a lot of customization options to play with. Let's discuss each tab, labelled A, B & C.
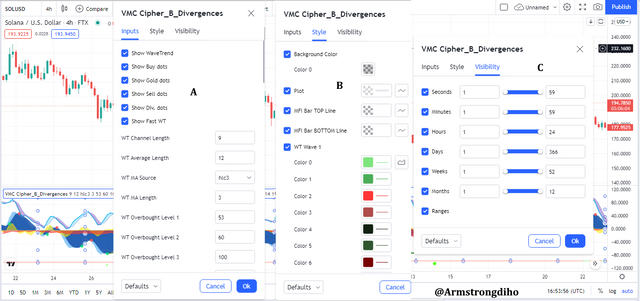
- A represents the Input tab and provides the trader with customization options with respect to what type of data they need to be fed into the VuManChu Cipher B Indicator. Based on the method thought in this class, our customization choices here will involve unticking the "Show WT Regular Divergences" as well as the second similar option "Show 2nd WT Regular Divergences". Also, scroll down the input tab to untick the "Show Stochastic RSI" since this will not be relevant for this exercise. The input tab customizations are shown below:
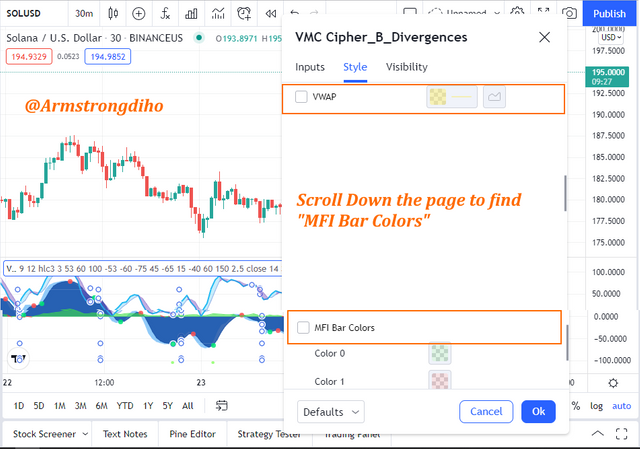
- B represents the Style tab in which you can customize how your indicator appears. While styling is usually a thing of personal preference. Here are some recommended styling customizations that should be done: the following additional indicators should be removed, namely: VWAP, and the MFI bar colours. This is necessary to achieve a clean looking and uncluttered chart fitting for mapping out this trading strategy.
- C represents the visibility tab in which the trader selects elements he/she would like to see on the indicator. This section is best left as it is. Though, you may modify it if you absolutely know what you are doing.
Question 3: Explain the appearance of the VuManChu Cipher B Indicator through screenshots. (You should Highlight each important part of this indicator by explaining their purpose)
As seen in question 2 above, I have visually explained how to add this unique indicator to a chart, as well as how to modify them. Having that in mind I will explain this indicator.
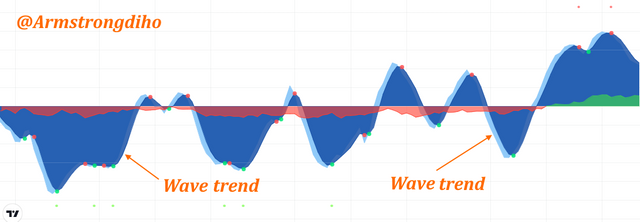
• WAVE TREND
It is composed of 2 lines, which are the dark blue and light blue lines that hover below and above the zero line. This wave trend is quite large as seen in the screenshot below. When the light blue line and the dark blue line cross each other, it shows that the trend of the market will change and also those which have control over the market, that is either the buyers or the sellers. It can also be noticed that there are very tiny dots on the wave trend, and these dots are seen as either green or red. The green dot tells a trader that the market is bullish, while the red dot signifies that the market is bearish. This is shown in the screenshot below.
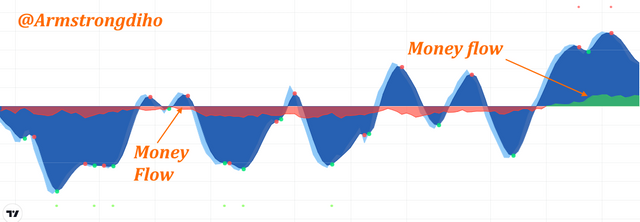
• MONEY FLOW
Looking at the screenshot below, we can see a cloud-like wave that appearance in green and red, with the green appearing above the zero line, and the red appearing below the zero line. The red cloud-like appearance is used to show the outflow of money, which could show a bearish trend, as well as a decline in the price of that asset. While the green cloud-like appearance is used to show money inflow, which indicates a bullish market.
In a nutshell, taking note of this important information while using this indicator will help a trader make a very good and profitable trade. Below is the graphical representation of the different aspects of the VuManChu Cipher B Indicator:
Question 4: Demonstrate your preparation for the Trading Strategy combining other indicators.
To prepare the trading chart for trading proper, with our chart set up and ready, we need to combine other indicators for better confirmation of trend directions as well as for the purpose of carrying out confluence trading which is a reliable trading principle.
Based on the lecture, and numerous other lectures, we will be combining several indicators including the 200 and 55 Exponential Moving Averages, as well as the Bollinger Bands indicator.
For individual securities or indexes, moving averages can help uncover trends in price changes by smoothing out noise and inconsistencies in the market, as well as short-term spikes (from news and earnings releases, for example). We can discover early signs by employing moving averages of periods 55 and 200, as EMAs react faster to market fluctuations. In an uptrend, moving averages like the 55-day exponential moving average and the 200-day exponential moving average can be used to identify support levels since the average acts as a floor (support) and the price bounces up off of it. In a downturn/downtrend, a moving average can act as resistance; like a ceiling, the price meets the level and then starts to fall again.
Based on the foregoing, these indicators will be applied to the chart below by simply navigating to the indicators  section in TradingView app and search for Moving Average Exponential
  , select it to apply to the chart. Quickly configure the length of the EMA to 200 EMA
  , and proceed to add another EMA, and this time configure to 55
  . You may want to use different colours for the EMA 55 and EMA 200, to easily tell them apart.
Next, to beef up the strategy, you could add the Bollinger Bands Indicator to more precisely identify important overbought and oversold zones on the trading chart. This is only possible if you are a TradingView premium subscriber.
Question 5: Graphically explain how to use VuManChu Cipher B Indicator for Successful Trading
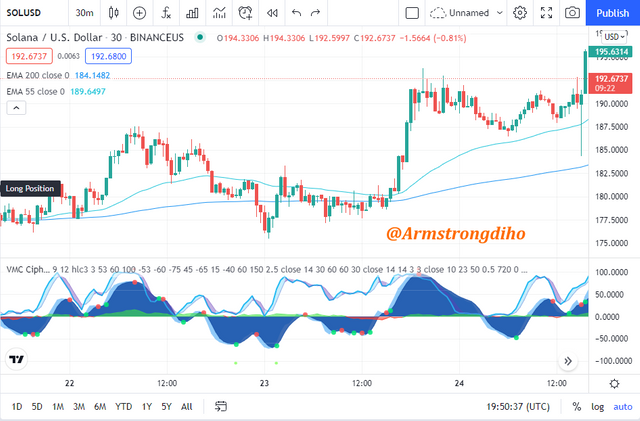
To successfully use the VuManChu Cipher B Indicator for successful trading, we must confirm the direction of the trend with both the VuManChu Cipher B Indicator and the Exponential Moving Averages applied to the trading chart. Let's apply this basic principle to a bullish and bearish trade.
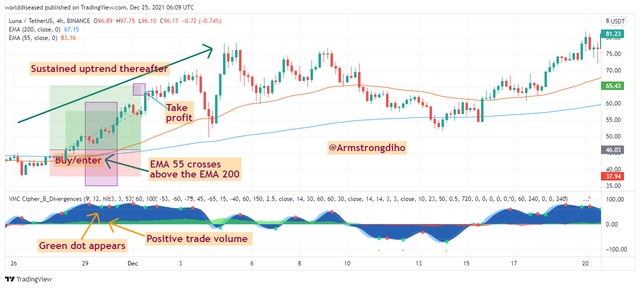
Buy/Bearish Trade
Here, the aim is to with the aid of the VuManChu Cipher B Indicator and the accompanying EMAs, confirm that a trend will stay bullish for some time so as to enter the market at a profitable point. To do this, we simply need to wait till the 55 EMA crosses above the 200 EMA, signaling a bullish trend and thereafter confirm this trend using the VuManChu Cipher B Indicator. On this part of the chart, simply observe the VuManChu Cipher B Indicator wave indicator and see if the wave indicator crosses each other and a green dot appears within the point in which the EMA's form. If these two conditions are met, a long bullish trade can be entered. This is shown in the screenshot below:
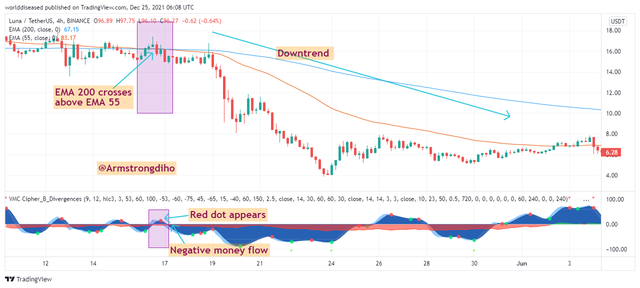
Sell/Bearish Trade
To make a sell entry in a bearish market, we basically do the reverse of the above. Here, we wait for the 200 EMA to cross above the 55 EMA, then confirm the bearish movement on the VuManChu Cipher B Indicator in which money flow must be red (red cloud) and a red dot is formed around this point. When this conditions are satisfied, it is evident that the market is experiencing a bullish phased. At this point, a bearish entry may be executed.
Question 6: Using the knowledge gained from previous lessons, do a better Technical Analysis combining this trading Strategy and make a real buy or sell order in a verified exchange
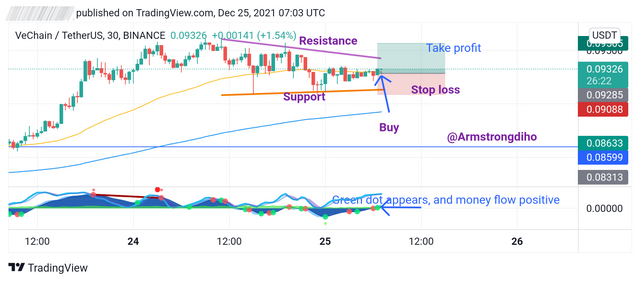
Having observed the EMA 55 crossover of the EMA 200 earlier, it was evident that the VET/USDT was still enjoying a bullish movement. However, I still ensured that the EMAs (200 & 55) are not intercepting or attempting to which will signal a potential trend reversal. Moreover, I also confirmed the VuManChu Cipher B Indicator indices to ensure that money flow is still at a fair and positive level and the green confirmatory dot signaling the continuation of the trend was identified. However, since the EMA 55 - EMA 200 crossover has been late, I placed a short buy other with take profit and stop loss at a ratio of 2:2. This trading set up is shown below:
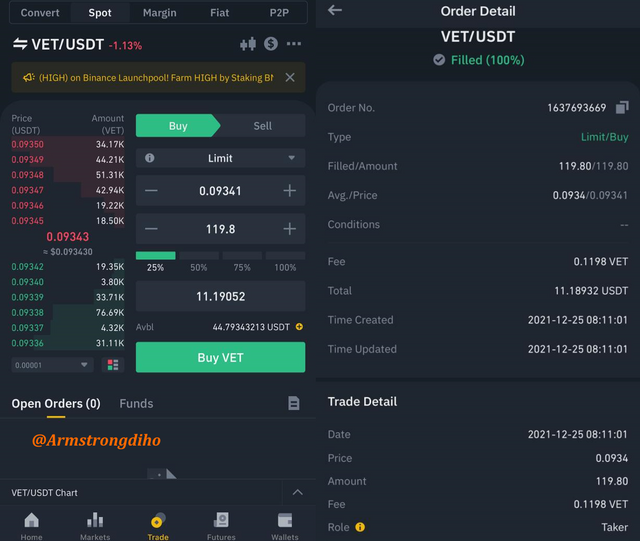
Thereafter, I went ahead to place my trade on Binance, shown below:
Conclusion
The VuManChu Cypher B indication is made up of a number of indicators, including the money flow, relative strength index (RSI), market volume and momentum, and so on. This indicator represents the cumulative volume flow (inflow and outflow) with two lines that fluctuate within the asset's wave trend and is useful for both experienced and inexperienced traders. It's simple to use. Adding moving average indicators to VuManChu Cipher B allows traders to anticipate market moves more accurately. Professor @reddileep, thank you for your informative and enlightening lesson.
Otherwise indicated, all charts and screenshots were made from TradingView; trade was completed using Binance mobile app, thus screenshot was obtained from within the app
