Crypto Trading With Rate Of Change (ROC) Indicator - Crypto Academy /S4W8-Homework Post for @kouba01

In your own words, give an explanation of the ROC indicator with an example of how to calculate its value?And comment on the result obtained.

Price movement does not move in one trend direction instead moves laterally as a result of the volatile nature of cryptocurrency. Hence, it is ideal for a trader to make use of technical indicators and other technical tools as a means of support and confirmation when trading. Though we have discussed lots of indicators, and it's various functionalities but in this task, I will be discussing the indicator that spot new formation of trend, trend reversal, identify the current strength of a trend and the status of the market if it is still in a lateral phase or not, thus this indicator is known as Rate Of Change (ROC) Indicator.
IMAGE SHOWING THE NATURE OF RATE OF CHANGE (ROC) INDICATOR
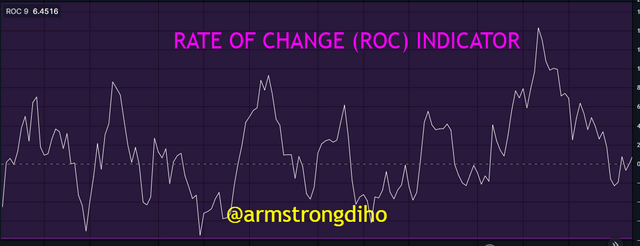
The Rate of Change (ROC) indicator is a momentum-based indicator that measures the diverse percentage change in price from the current price to the price of the asset within an observed period ago known as the 'n' period. Looking at the image below, we observed that the ROC is represented with an oscillating line that is set against a zero-level known as the midpoint as such fluctuates above and below the zero line indicates positive zone(uptrend) and negative zone(downtrend).
When the oscillating line of Rate-of-Change that is set against the midpoint moves from the positive zone to the negative zone signifies the presence of a possible downtrend if the price action corresponds with the indicator and also from the negative zone to the positive zone signifies the presence of a possible uptrend if the price action corresponds with the indicator.
Moreover, when the trader picture out the positive zones and negative zones early, it serves as an opportunity to long and short the trade respectively. Perhaps they also use the ROC indicator to understand the status of the market by identifying divergences, midpoint crossovers, overbought and oversold conditions, and trend identification. All these are benefit traders derived from the ROC indicator signals.
ROC INDICATOR CALCULATION
Understanding and interpreting ROC is very good, however, the method of calculating the indicator worth focusing on since knowing the mathematical expression indicate the price percentage change as such is very useful to the technical analyst. The current price Minus the price of "n" period ago divided by price of "n" period ago, then multiple by 100. Let's check out the following formula below for better clarification.
ROC = (Cp - PnP) / PnP × 100
Where:
n = Observed period
Cp = Current Closing Price
PnP = Price of Observed (n) Period ago
Let's check out the calculation using the illustration with an example.
Suppose the price of Solana is at $199.8 today and the price of Solana days ago was $156.90. Let's check out the required calculation using the formula below.
ROC = (Cp - Pnp) / Pnp × 100
Cp = $199.80
PnP = $156.90
ROC =?

Then, based on the ROC over the 9-period look-back the calculation would be
ROC-9 = [199.80 - 156.90]/ 156.90 × 100
ROC-9 = 27.3%
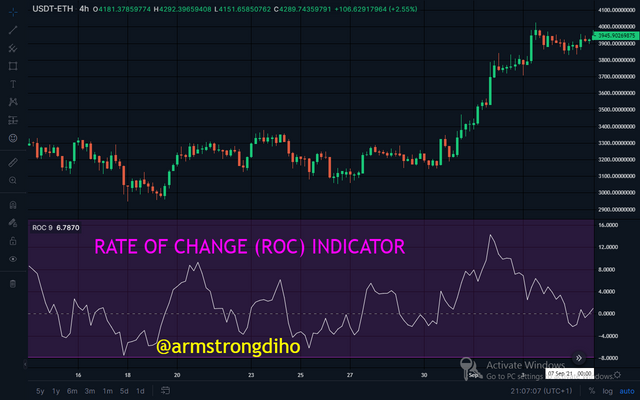
The above illustration and calculation, the ROC indicator indicates that the price of SOLUSDT whipsaws upward from $156.90 to $199.80 by about 27.3% in the last 9days periods, which is an uptrend movement. Also, as seen on the chart that the oscillating line is above the midpoint which means it is in positive territory as such signifies an uptrend.
Demonstrate how to add the indicator to the chart on a platform other than the tradingview, highlighting how to modify the settings of the period(best setting).(screenshot required)
Here, in this section, I will provide information on how to add Rate Of Change (ROC) Indicator on a crypto chart and Its settings via
Bittrex platform. Remember can access this link without have an account with them.


IMAGE ABOVE SHOWING BITTREX PLATFORM & MARKET INTERFACE


IMAGE ABOVE SHOWING INDICATOR SEARCH ENGIN AND APPLYING ROC ON THE CHART

Finally, the ROC indicator is automatically added to the ETH/USDT chart just as shown below.
IMAGE SHOWING ROC INDICATOR ADDED ON THE CHART
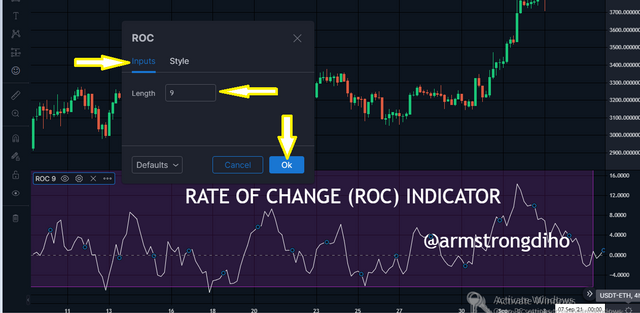
Let's check the configuration of the Rate of Change (ROC) Indicator. However, the setting is very easy, as it has two (2) sections; Input and Style.
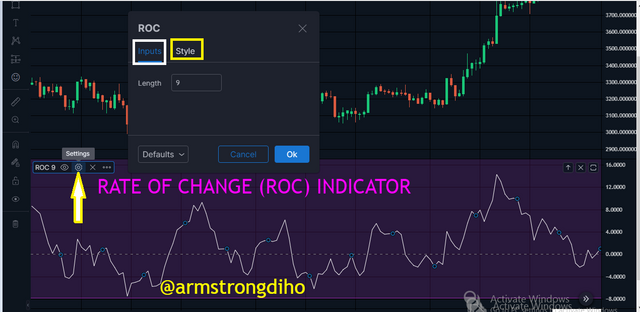
INPUT SECTION;
This section of the setting entails the specific period in days in which the users have the choice to set the period that defines their trading style. But as seen in the chart, Length 9 is the default.
IMAGE SHOWING INPUT SECTION OF ROC
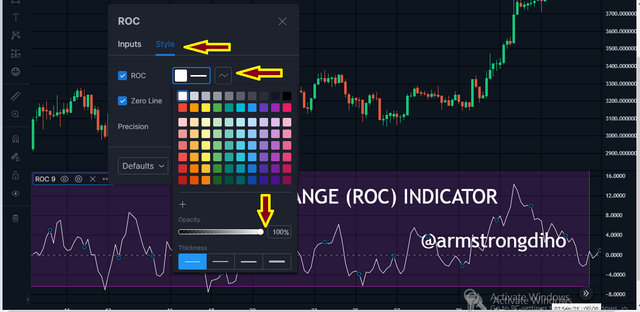
STYLE SECTION
This section of the setting entails the status of the style of the indicator. The user can change the colour, adjust the thickness, and the lines of their choice just as I changed mine from blue to Red.
IMAGE SHOWING THE STYLE SECTION OF THE ROC SETTINGS
Here we have successfully configured the indicator, however, to adjust the settings, you can follow the steps above.
Best Settings.
The popular period most platforms set as default is 9 days. Notably, the short-term traders prefer lower periods such as 9 or 12. The lower settings on the ROC indicator needs carefulness when making trade decision since it reacts more quickly to price changes, and can generate more false signals.
While long-term traders prefer high periods such as 25days and above. The higher settings on the ROC indicator is very sensitive as it could provide more meaningful and good signals but the indicator reacts slowly to price changes.
It is ideal to know that there is no absolute period being it 9, 12, 14, 25, etc that is known as the right settings. Rather, the best setting depends on the trader and we can define that using the success rate( result) produced from the trade.
What is the ROC trend confirmation strategy? And what are the signals that detect a trend reversal? (Screenshot required)
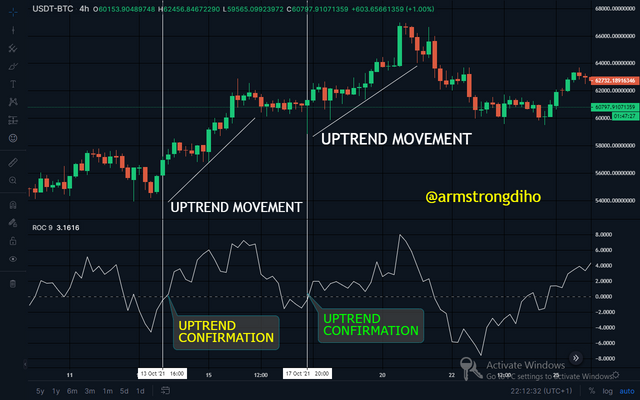
It is always beneficial to trade on a trend. However, identifying them earlier means the trader will ride on it as such could make a huge profit. Thus, each indicator has its various roles to serve as a possible means of confirming the direction of the trend, which the ROC indicator can address via the centerline crossovers. So let's check it out.
TREND CONFIRMATION
When the oscillating lines of the ROC indicator cross above and below the midpoint and constantly rise above and fall below, it signifies an uptrend and a downtrend respectively.
Basically, using the ROC indicator to confirm an uptrend is when the indicator line whipsaws upward above the midpoint and constantly rising above indicates a Bullish trend confirmation. Thus, crossover above the midpoint confirms a positive territory which means an uptrend.
IMAGE SHOWING UPTREND CONFIRMATION
Also, using the ROC indicator to confirm a downtrend is when the indicator line whipsaws downward below the midpoint and constantly falling below indicates a bearish trend confirmation. Thus, crossover below the midpoint confirms a negative territory which means a downtrend.
IMAGE SHOWING DOWNTREND CONFIRMATION
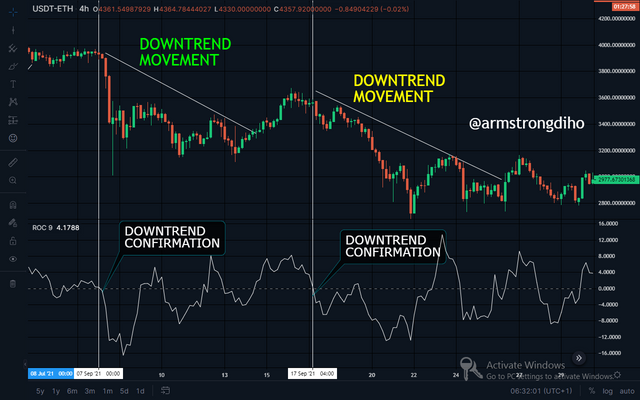
I believe the above image will clarify us better about the trend confirmation. Having known about the trend confirmation, let's check out the trend reversal using the ROC indicator.
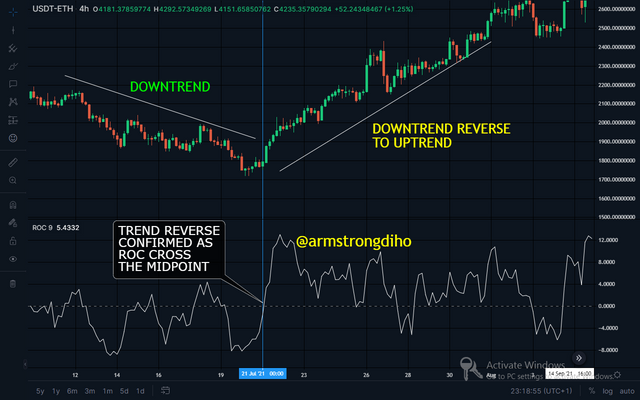
TREND REVERSAL
Using the ROC indicator to detect trend reversal is very simple and this can be derived from the centerline crossovers. We can detect trend reversal when the oscillating lines of the ROC indicator above the midpoint start to decline this is a sign of trend reversal. Once it declines and crosses over below the midpoint and constantly falls below indicates a bullish trend reversal to a bearish trend.
IMAGE SHOWING BULLISH TREND REVERSAL TO BEARISH TREND
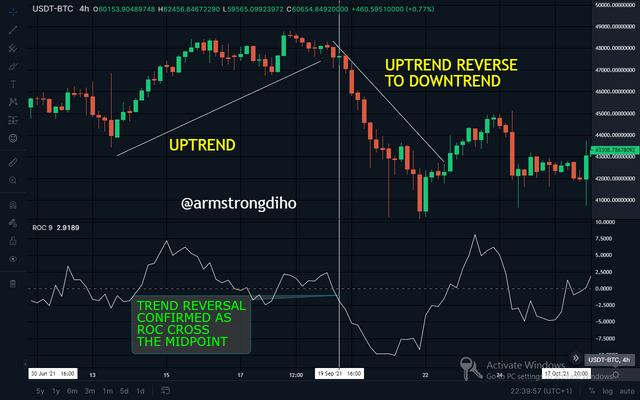
Note; The market turned from bullish to bearish trend only when we confirmed the oscillating line of the Rate Of Change (ROC) Indicator which was above, declined and crosses the midpoint from above to below. just just as seen on the crypto chart above.
Perhaps when the oscillating lines of the ROC indicator below the midpoint start to rise this is a sign of trend reversal. So, once it rises and crosses over above the midpoint and constantly rises above indicates a bearish trend reversal to a bullish trend.
IMAGE SHOWING BEARISH TREND REVERSAL TO BULLISH TREND
Note; The market turned from a bearish to bullish trend only when we confirmed the oscillating line of the Rate Of Change (ROC) Indicator which was below, rises and crosses the midpoint from below to above. Just as seen on the crypto chart below.
What is the indicator’s role in determining buy and sell decisions and identifying signals of overbought and oversold؟(screenshot required)
Determining buy and sell decisions and identifying signals of overbought and oversold can be obtained through crossovers. It is relevant to make trade decisions either buy or sell when the market is observing a trend. Once a trader spots a trend early, then making a trade decision is possible because the ROC indicator will move either below or above the midpoint. Let's check it out separately.
BUY DECISION
When the oscillating line of the Rate Of Change (ROC) Indicator crosses above the midpoint and consistent rising indicates a BUY decision. Though it is very important to note that we shouldn't rush and make a buy decision when the ROC indicator crosses above the midpoint since most times the indicator might pull back quickly and continue downward movement even when it moves above the midpoint which will hit the stop-loss as such we have lost certain cash.
So, it is ideal we should also focus on the asset price action, if it's consistently moving upward and the indicator has crossed above the midpoint it is a perfect time to long the trade as such buy decision is obtained.
IMAGE SHOWING BUY DECISION
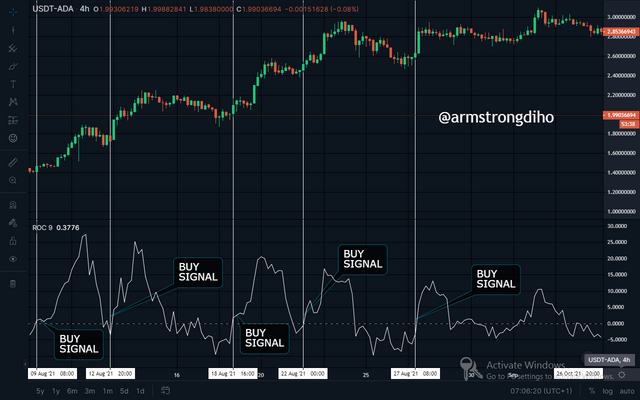
From the crypto chart above, we can see the possible point marked as buy signals as the indicator line cross above the midpoint corresponding upward move with the asset price action which is a perfect time to make a buy trade decision.
SELL DECISION
When the oscillating line of the Rate Of Change (ROC) Indicator crosses below the midpoint and consistent falling indicates a SELL DECISION. Though it is very important to note that we shouldn't rush and make a sell decision when the ROC indicator crosses below the midpoint since most times the indicator might pull back quickly and continue an upward movement even when it moves below the midpoint which will hit the stop-loss as such we have lost certain cash.
Thus, we should also focus on the asset price action, if it's consistently moving downward, and the indicator has crossed below the midpoint it is a perfect time to short the trade as such a sell decision is obtained.
IMAGE SHOWING SELL DECISION
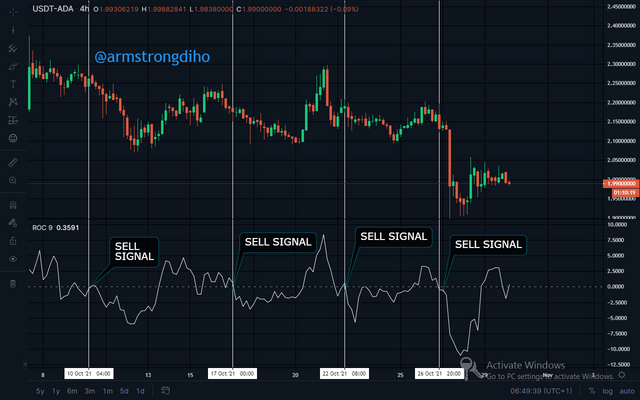
From the crypto chart above, we can see the possible point marked as sell signals as the indicator line cross below the midpoint corresponding downward move with the asset price action which is a perfect time to make a sell trade decision.
OVERBOUGHT AND OVERSOLD SIGNAL
To demonstrate oversold and overbought signals, I will be using 2 additional lines to the ROC indicator which will indicate the upper and the lower limits. Hence, I will use a +/- 7% limit to illustrate this so, let's check it out.
The +7% represent the yellow horizontal line, while -7% represent the white horizontal line.
OVERBOUGHT SIGNAL
With the marked points, when the oscillating lines of the ROC cross or test the yellow horizontal line (+7%) corresponding move with the asset price action, this identify signals for overbought as such it is a possible sell signal for traders.
IMAGE SHOWING OVERBOUGHT SIGNAL
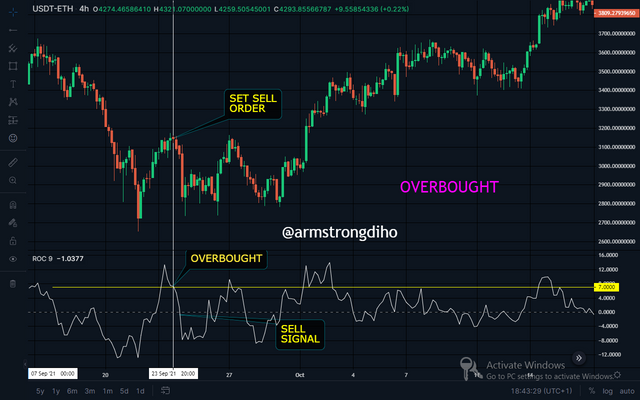
In the image of the crypto chart above, we can see the possible point marked as overbought zones as the indicator line cross or test the +7% corresponding move with the asset price action which is a perfect time to make a sell trade decision.
OVERSOLD SIGNAL
Also, when the oscillating lines of the Rate Of Change (ROC) Indicator cross or test the white horizontal line (-7%) corresponding move with the asset price action, thus, this will be identified as signals for Oversold, as such it is a possible buy signal for traders.
IMAGE SHOWING OVERSOLD SIGNAL
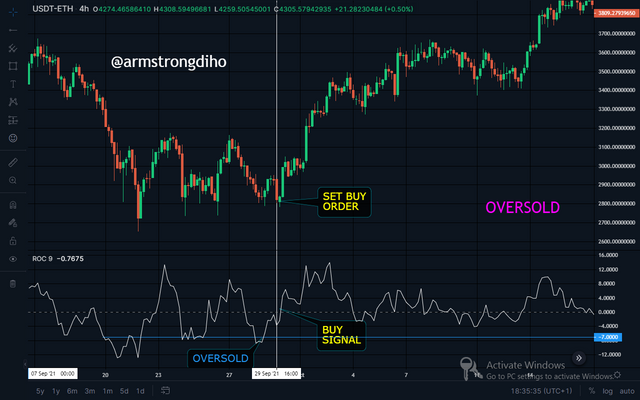
In the image of the crypto chart above, we can see the possible point marked as an oversold zone as the indicator line cross or test the -7% corresponding move with the asset price action which is a perfect time to make a buy trade decision.
How to trade with divergence between the ROC and the price line? Does this trading strategy produce false signals? (screenshot required)
In the crypto ecosystem, the word divergence always occurs when using indicators and the asset price action. Thus, divergence simply means when the direction of the asset price is not corresponding with that of the indicator. However, divergence could signal a possible early trend reversal before the asset price action corresponds later. Let's check out the Bullish and bearish divergence separately.
BULLISH DIVERGENCE
Bullish divergence simply means when the price action of the asset whipsaw downward and at the same time interval, the ROC indicator whipsaw upward which means the asset price action and the ROC indicator is moving in a different direction. Thus, this could indicate an uptrend transition.
IMAGE SHOWING BULLISH DIVERGENCE
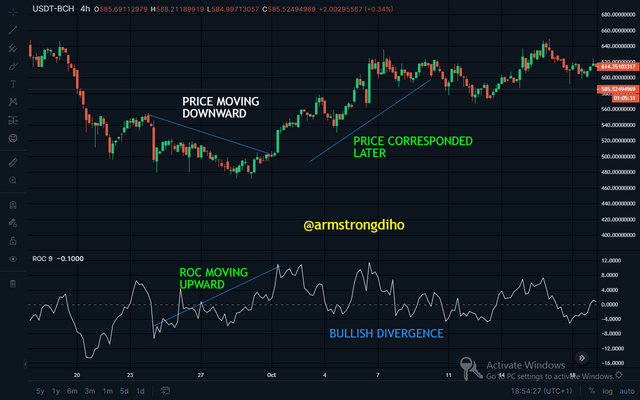
Looking at the image above well clarified that the price action on the chart whipsaw downward showing a downtrend signal, and at the same time the ROC indicator whipsaw upward showing an uptrend signal. Although the price action could further correspond with the indicator signals.
BEARISH DIVERGENCE
Bearish divergence simply means when the price action of the asset whipsaw upward and at the same time interval, the ROC indicator whipsaw downward which means the asset price action and the ROC indicator is moving in a different direction. Thus, this could indicate a downtrend transition.
IMAGE SHOWING BEARISH DIVERGENCE
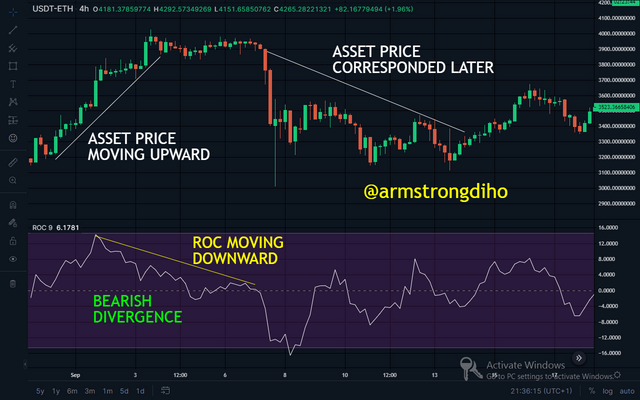
Looking at the image above well clarified that the price action on the chart whipsaw upward showing an uptrend signal, and at the same time the ROC indicator whipsaw downward showing a downtrend signal. Although the price action could further correspond with the indicator signals by moving downward.
Having understood what divergence(bullish & bearish divergence) is all about and how it can result in reversal. Also, it is very important to know that when trading with divergence, carefulness and trading it in the right way is needed because most times it can generate false signals which I will explain below. It is very good when identified but rare and the trader have to focus on the asset price action or other technical indicators for confirmation.
Does this trading strategy produce false signals
Yes
Virtually, false signals can be generated with this trading strategy. Technical indicators can not provide 100% accuracy every time most especially when used as standalone. So, it is very possible we can receive false divergence using this strategy since the market can be manipulated as well as the volatile nature of crypto-asset which might affect the percentage change of the market as such there could be no trend reversal.
To sum it all, there are high chances for false signals to occur when using this trading strategy. However, false divergence is when the opposite direction of the asset price action and the indicator is unconfirmed or undefined.
Suppose an asset price movement is in an uptrend, and the oscillating line of the ROC is in a downtrend at the same time which means they are undefined. Thus, a trader who identified that may speculate the asset price will reverse from uptrend to downtrend. The trader will place a short trade and it occurs that the asset price continues its movement upward. This means the trader could lose certain cash if unfortunately, the trade hits stop-loss.
IMAGE SHOWING FALSE DIVERGENCE
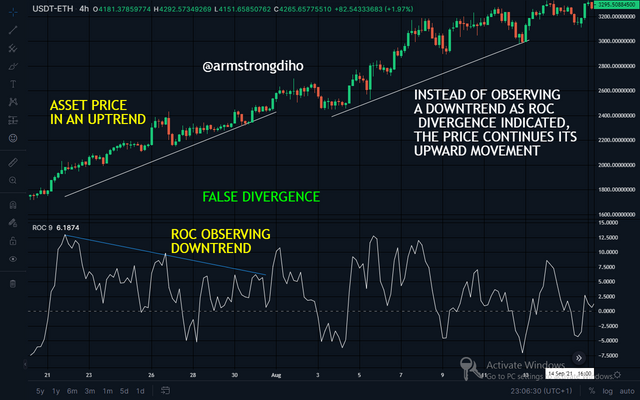
From the crypto chart above, we can see the price action is experiencing an uptrend movement, and the value of Rate of Change (ROC) is in a downtrend movement which is a clear bearish divergence. Perhaps, this means a trader who noticed this bearish divergence will short the trade after getting a confirmation from the ROC bearish divergence which have suggested that there will be a downtrend transition that's the asset price action will further follow the direction of the indicator.
Unfortunately, the asset price action slightly moves downward and continue its upward movement without following the suggestion of the bearish divergence as such, we can say False divergence has occurred.
How to Identify and Confirm Breakouts using ROC indicator?(screenshot required)
When a trend gets weak or in a range market, and there is a huge volume in the market, the price of an asset will be altered significantly which could change the direction of the movement either upward or downward based on the direction of the momentum as such breaking the previous resistance and support zones we can refer this concept as breakout.
However, we can use the Rate Of Change (ROC) Indicator to spot breakout. So, let's check out the following example below for better clarification of using the ROC indicator to find breakout.
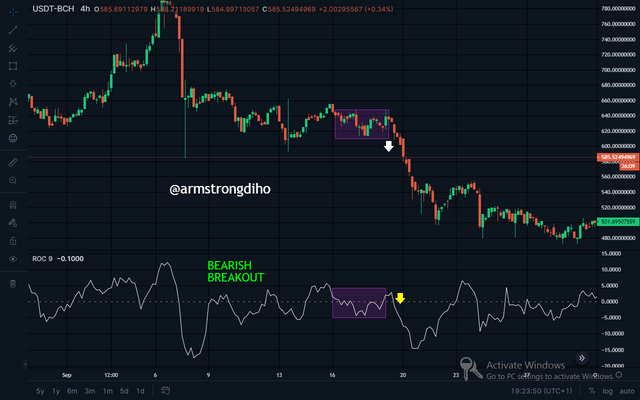
IMAGE SHOWING BEARISH BREAKOUT
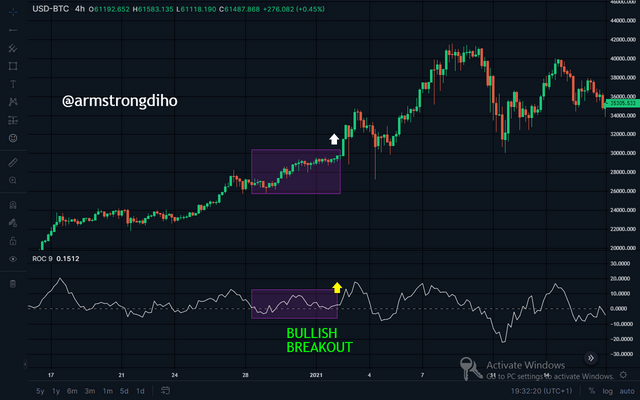
From the image above, we can see the movement of the price is in a range market. Conversely, the ROC confirmed the range market as seen on the chart. But when there was momentum in the market, instantly the value of the Rate Of Change (ROC) Indicator intersect below which indicates a breakout but not yet a bearish breakout until it breaks the previous support level and as it consistently falls, it is a confirmation of the bearish trend.
In summary, once we observe a sideways movement in any market on both the asset price action and the ROC indicator line, with an apparent resistance and support zones. Remember the indicator line is swinging close to the midpoint. Thus, once the previous support level breaks, we can refer to this concept as a bearish breakout.
IMAGE SHOWING BULLISH BREAKOUT
From the image above, we can see the movement of the price is in a range market. Conversely, the ROC confirmed the range market as seen on the chart. But when there was momentum in the market, instantly the value of the Rate Of Change (ROC) Indicator intersect above which indicates a breakout but not yet a bullish breakout until it breaks the previous resistance level and as it consistently rises it is a confirmation of the bullish trend.
To sum it up, once we observe a sideways movement in any market on both the asset price action and the ROC indicator line, with an apparent resistance and support zones. Remember the indicator line is swinging close to the midpoint so once the previous resistance level breaks, we can refer to this concept as a bullish breakout.
Review the chart of any crypto pair and present the various signals giving by ROC trading strategy. (Screenshot required)
I have mentioned lots of signals in the above question but here I will use various signals provided by the Rate Of Change (ROC) Indicator, to read the chart for ETH/USDT. Let's check out the charts below to see the various signals. Looking at the chart, it's self-explanatory as I have mapped out the areas of the signals but I will clarify us for better understanding.
IMAGE SHOWING VARIOUS SIGNALS
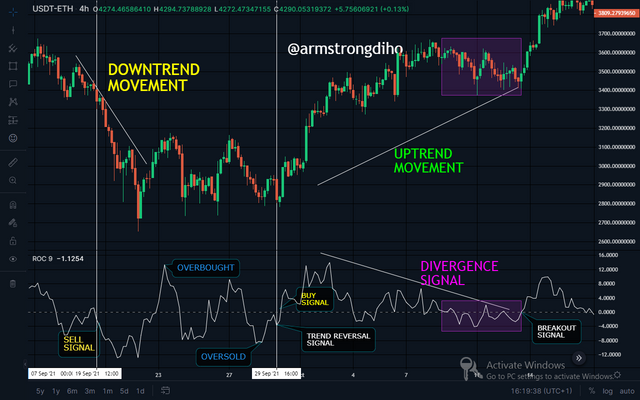
From the chart, we can see a bearish and bullish trend with sell and buy signals respectively. The market was in a downtrend creating sell signals instantly as a result of high pressure from the buyers, its rise and formed overbought.
However, the sellers put high pressures and the ROC signals were oversold before a trend reversal occurred from downtrend to uptrend creating buy signals as well. Also, there was a divergence signal precisely bearish which created a small sideways before the breakout took place.
From this chart, there are lots of signals as such great opportunities for traders.
CONCLUSION
The ROC indicator is a very important momentum-based indicator that traders can use to picture out trends, divergence, and to identify the status of the market if it's in an overbought or oversold condition.
However, as a result of the volatility of the price of crypto assets, analysing the price action is of course of utmost importance.
From what we observed during the configuration setting, using a lower period can result in very choppy readings whereas when using a higher period, the signals can be very delayed. So, this is a problem for some traders most especially the ones that are not savvy. However, it is ideal to know that when applying the ROC indicator to the chart, the technical analysts or traders should focus majorly on analyzing the asset price movement properly before using the ROC indicator.
Moreover, it is also ideal to make use of another technical indicator as a means of support and confirmation since only one indicator is not good to use as a standalone.
THANKS FOR READING THROUGH
CC
@kouba01
Hello @armstrongdiho,
Thank you for participating in the 7th Week Crypto Course in its 4th season and for your efforts to complete the suggested tasks, you deserve a Total|9.5/10 rating, according to the following scale:
My review :
Excellent content in which you were able to answer all questions related to the ROC indicator with a clear methodology and depth of analysis which is a testament to the outstanding research work you have done.
Thanks again for your effort, and we look forward to reading your next work.
Sincerely,@kouba01
Thanks Prof @kouba01 for your review.