Crypto Academy : Season 3 : Week 3 - Homework Post FOR @lenonmc21
INTRODUCTION

In crypto ecosystem, each trader has its own trading plans and strategy to analyse the movement of the market. However, to maximize profit, there are basic things needed to understand in the chart which passes information regarding the activities of the market. Trend, support and resistance, chart patterns are some of the things trader needed to know the price actions of an asset.
What is a Trend?
Naturally, anytime there's gravitational pull of the moon, water bodies like ocean will rise and falls along a shoreline. This can as well be applied in crypto ecosystem, where the movement of price of assets rise and fall within specific timeframe called Trend, as such forming swings highs and swing lows which can be as a result of the volatility nature in crypto market.
The general price movement of an asset or market at a given timeframe is called Trend. This price action always move in a specific chart pattern forming swing highs and swing lows as well as support and resistance levels. However, once a technical analyst observes that the swing points has been formed, the treader will then make a trade decision most especially when the levels tested twice or more.
Basically, we have two trend which are as follows:
Uptrend or Bullish trend✓
Downtrend or Bearish trend ✓
Uptrend or Bullish trend
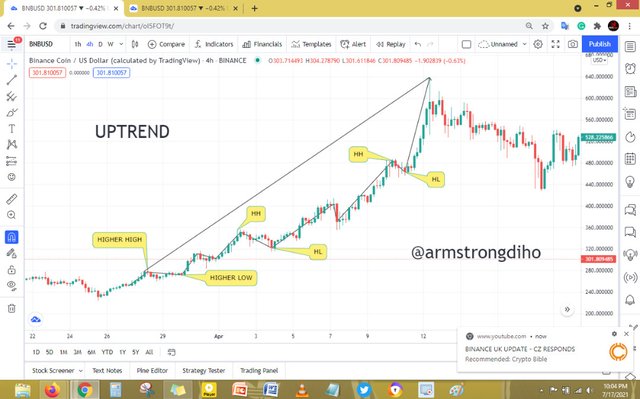
Uptrend = Higher highs and Higher lows✓
Generally, an uotrend consists of swing points; higher highs and higher lows and always understand that the first swing high and swing low respectively will be below the second ones. Hence, I can say that a price direction of an asset can said to be in an uptrend when the higher low is able to maintain it's upward movement as such forming higher highs. That's an uptrend must have a big impulsive move and little retracement or pullback. Once the higher highs start getting weak it shows that there might be a downtrend transition.
Downtrend or Bearish trend
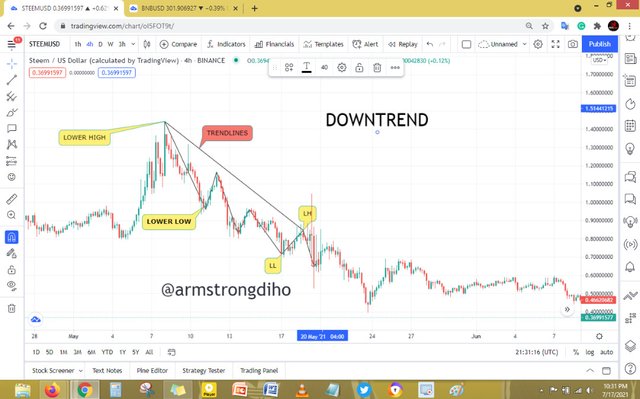
Downtrend = lower Highs and Lower Lows ✓
Generally, the downtrend is compose of lower highs and lower lows, and always understand that the first swing lows and highs respectively will be above the next ones. Therefore, price of an asset can said to be a downtend when the higher low fails to maintain it's upward direction and falls lower which then forms the lower low. Once the lower low start getting weak it shows that there might be an uptrend transition.
The role of Trend in charts?
Any trader who understands how to identify a trend has the chance to gain profits. So with the help of the trend, one can identify the market activity. That's to know between the buyers and sellers who is in control at a given timeframe. An uptrend or Bullish trend then tells us that the buyers are in charge of the market, while downtrend or Bearish entails that sellers are in charge of the market.
TREND LINE
Basically, trendline is the tools technical analyst user to pick up trend. That's it is used to identify the movement of a trend as such the swing highs and swing lows can be seen with the help of the trendlines.
The role of Trendlines in charts?
Basically, without the trendlines, technical analyst might found it so difficult to identify trends most especially beginner traders. So the role of the trendlines are to give clearer picture of a trend. Also, treader uses it to draw lines trend on the chart to make the trend more clearer, as such link numbers of prices together which the technical analyst then use to predict a future trend. With the help of the trendlines, swing highs and swing lows can be properly identified.
HOW TO DRAW AN UPTREND LINE AND A DOWNTREND LINE
The act of identifying trend early is very essential because it makes a trader to maximize profits. Though it might need time and experience to identify trend. However, identify a trend is good but to draw it is another problem most traders find difficult.
Basically, when you identify a trend, the best is to do the following remember this is my our ways;
Zoom out your chart, also you can change the chart to line chart to enable you see the trend clearer.
Identify the swing highs and swing lows.
After that you can use the trendlines to connect swing highs and swing lows to creat a channel on the line chart. For uptrend, connect the higher highs to the higher lows, while for the downtrend, connect the lower highs to the lower low. These swing highs and swing lows must be tested like twice or more.
Then you can now change your chart to candlestick.
UPTREND
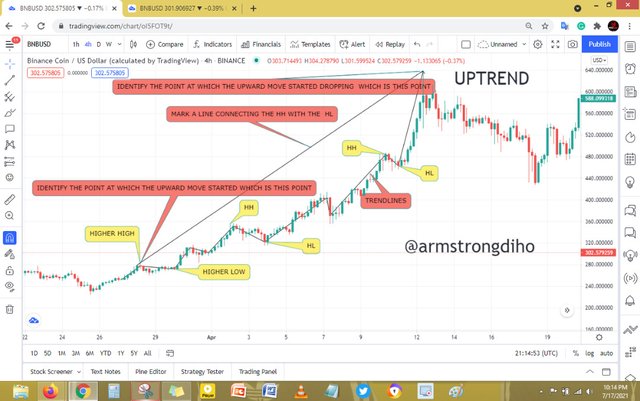
First observe if the price movement of an asset is in an upward movement. After that check if the swing highs and swing lows have tested twice or more. Then with the trendlines, pick it up with the trendlines to connect the higher high and the higher lows.
DOWNTREND
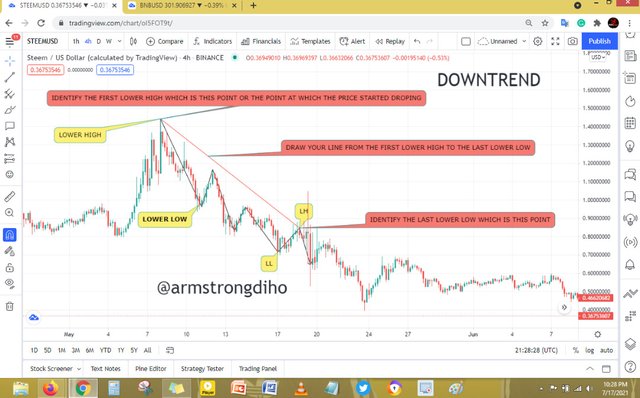
First observe if the price movement of an asset is in a downward movement. After that check if the lower highs and lower lows have tested twice or more. Then with the trendlines, pick it up to connect the lower highs and the lower lows.
SUPPORTS AND RESISTANCES ARE AND HOW WE CAN IDENTIFY BOTH ZONES
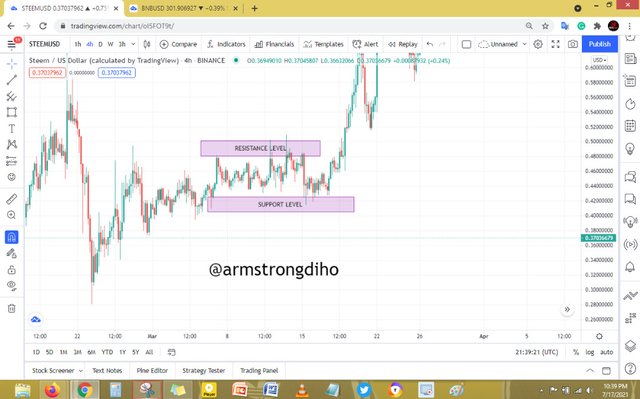
Support and resistance are important level that entails the price level of an asset on a chart. The level preventing price movement of an asset to exceed above standing as a barrier is called Resistance, while the level that prevent the price movement of an asset to exceed below standing as barrier is called Support.
Basically, analysing price movements of an asset using this vital levels should be recommended because it shows zones where price moves to and fro. However, some traders believe to buy an asset on support levels and sell on resistance level most especially when the market is ranging.
SUPPORT
The level at which the price of asset falls and pause within a given timeframe as a result of high demand from the buyers is said to be support level. Also a strong support level that has been tested multiple times finally breaks will the flips and becomes a resistance.
RESISTANCE
The level at which the price of asset rise and pause as a result of high supply from the sellers within a given timeframe is said to be Resistance level. A resistance level that has been tested a couple of times breaks. It flips and becomes a support.
Furthermore, Identifying support and resistance is very simple, and it only requires you to focus on areas where the price movement of asset rise and pause which is Resistance, and the areas where the price movement falls and pause which is the Support. And once it's identified, mark the levels. With this steps you can identify support and resistance. Also the chart below will make it more understandable.
SIMPLE CHART PATTERNS
large volume leads to rising and falling of trend as such creates Price pattern. Generally, this patterns are very important because some traders uses it to have a clear picture about the recent directions of the market as such can be used to predict the future directions of the market.
DOUBLE TOP
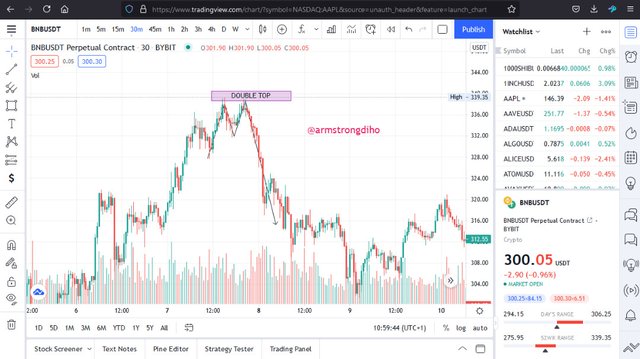
This is an important reversal pattern that traders use to analyse the market movements of an asset. Though it looks alike with that of the double bottom but its shape differs as the double top has "M" like shape where the point below is called the neckline. Once double top is observed, it shows bearish reversal trend which shows two equal consecutive highs at which the price of an asset falls below the neck line.
Double bottom
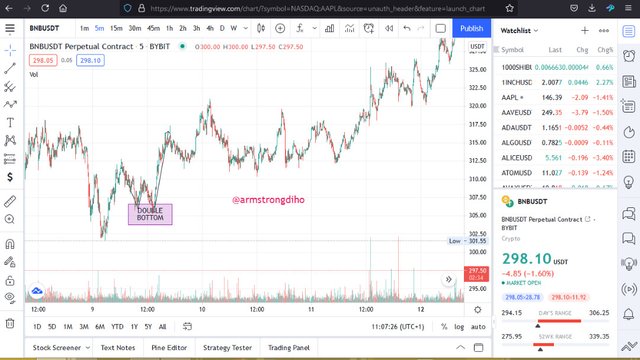
This is another important reversal pattern that traders use to analyse the market movements of an asset. It is the opposite of double top. Though it looks alike with that of the double top but has " W" shape that shows bullish movement of an asset.
The point at which the market decline stops then results to bullish rally is called the double bottom.
CONCLUSION
Trend, Support and Resistance, and chart patterns are very important to the technical analyst since they define the market movement, as such could be used to forecast future price movement. However, traders who understand the basic principles about trends, Support and Resistance level and chart pattern has an advantage to gain profit during trading any of the assets.
Although different traders has different strategies they use to analyse market movement as such these three can assist to give a clearer picture of the movement and which trader is dominating the market. Understanding all these phenomenon, enable you to make a good trade decision.
THANKS FOR READING THROUGH
CC:
@lenonmc21
Greetings @armstrongdiho. Thank you very much for participating in my class corresponding to season 3 (week 3), in the "SteemitCryptoAcademy ". However, unfortunately I am unable to rate your entry, I noticed that you posted your post incomplete and subsequently edited it by adding much of the content to it, which is not allowed.
Original Post:
Edited Post: