Crypto Academy / Season 3 / Week 1 - Homework Post by @armstrongdiho
INTRODUCTION

Trading cryptocurrency is one of the trending means that have really turned lots of people to millionaire and Billionaire. And there are lots of things like the candlestick, indicators and many others to used in order to determine the price movement of the Cryptocurrency.
Overview of Japanese Candlestick Chart
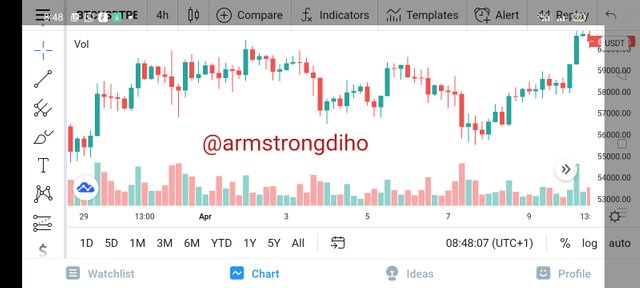
Basically, Japanese Candlesticks are one of the best tool trader or an analyst used in technical analysis and this is done by the use of chart to obtain an accurate information about price movement. Japanese candlestick chart is a graphical representation that shows the price movement and the effect of the demand and supply about crypto assets in a stock market within a particular timeframe.
However, the Japanese candlestick chart was realized in 1700s, developed by a rice merchant called Munehisa Homma. He developed this chart as a result of the price rotation which then made him to understand the effect of demand and supply. Afte his founding, he is refer as the father of candlestick chart, which is basically used in technical analysis by traders.
Basically, Japanese candlestick chart is mostly recommended because of how it represents information about price movement of assets. It entails more about the interaction between buyers and seller and how they influence the stock market in a particular timeframe. Crypto traders use these candlesticks to analyse and identify patterns of price movement which enable them to make a decision on when to enter a trade or to exit from the trade.
LINE CHART
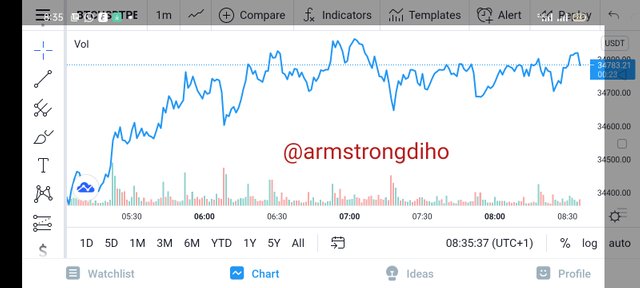
Line chart is an important chart which most traders often use. Some traders use the Line chart to identify trends( uptrend or downtrend) so easy. Line chart is a graphical representation that shows the price movement of cryptocurrency whereby the data points are in series using a single continuous line. It is very simple to understand because the data points needed are in series and is connected by straight lines segment over a specified time interval.
From the line chat it is observed that there's nothing like the low, high, and the open. And with this noise are reduced. Sometimes some traders most especially the beginner, normally find it difficult to visualize present price of an asset. But the line chart makes it more clearer for the treader to identify where the price of an asset has reached over a given timeframe.
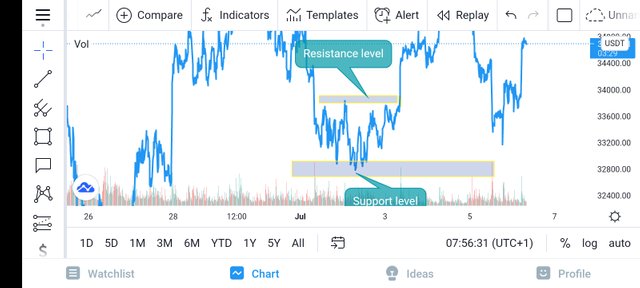
Moreover, using a line chart helps an analyst to identify the following vital things like trends, support and resistance levels, and to be able to recognize chart patterns. And it is recommended for the beginner trader due to it's simplicity to identify trend, Support and Resistance and chart patterns. Below image shows support and resistance level in line chart.
Although, a trader shouldn't use only line chart to make decision on when to enter the market or exit from the market because they may not provide an accurate information since it doesn't have the open, high, and low. All these mentioned, are used by traders as a strategy to determine the price of an asset.
Traders who determine price of an asset based on the information derived from the close will surely encounter lost. Hence, it is ideal to use other charts like the candlestick and so many others in conjunction with line chart to see more full technical pictureof an asset at a given timeframe before making a decision.
BAR CHART
Bar chart is another kind of chart that have price bar showing price movement over a given timeframe. In bar chart, there are multiple price bars and each have open, high, low and close prices. However, it seem difficult for beginner trader to identify the open, high, low, and close price.
From the image of the Bar chart, there are vertical line and left horizontal lines. The vertical line on the price bar shows the high and low price for the timeframe, while the right horizontal lines on the other hand represent the open and close price for the timeframe.
However, bar chart is used by technical analyst to monitor price movement, price fluctuations, identify trend and trend reversal of an asset. Bar chart majorly requires a savvy analyst because beginners may not understand the vertical line and horizontal.
REASONS WHY CANDLESTICK ARE IMPORTANT TO TRADER
Different technical analyst have different trading strategy but candlestick is a must used tools. Basically, for a technical analyst to make decision before trading, they must study and monitor the price movement and candlestick chart is one of the tools used. This is to say that the candlestick is very important tools an analyst can't do without because they provide an accurate information about price of an asset.
Another reason why candlestick chart is very important is that it enables the analyst to know the set of traders that are in control of the market for a given timeframe. If the buyers or sellers are in control of the market, with help of the candlestick chart the trader can identify that and will then make a trading decision.
NOTE; Long body candlestick tells us if the buyer or seller are in control.
Bullish Candlestick
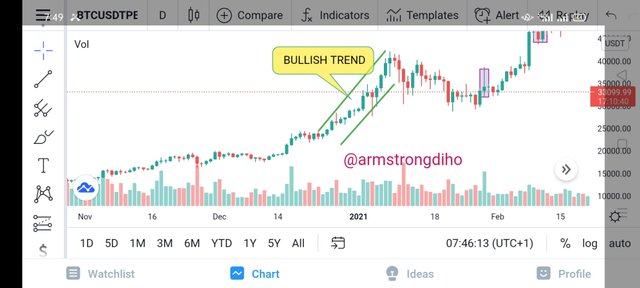
Basically in crypto space, anytime there is bullish candlestick, it represents buying pressure within a given timeframe. However, when bullish candlestick shows, it only favours traders that want to long trade their assets. With the help of the Bullish candlestick, a well savvy trader can predict the market is about to move from the downtrend direction to an uptrend direction.
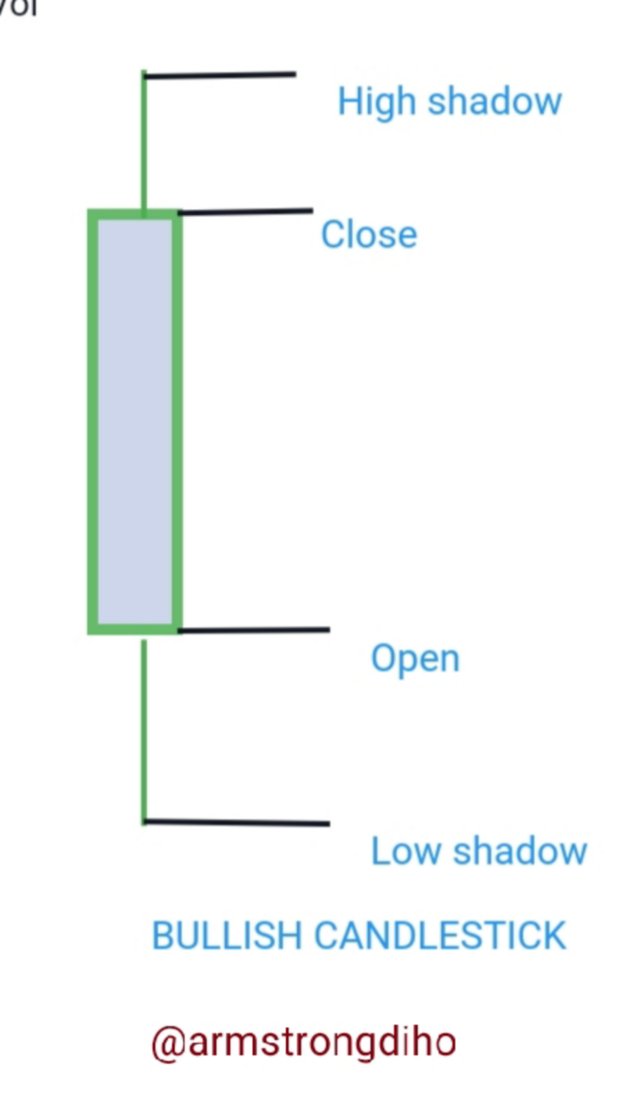
Bullish candlestick most especially the one with long body entails that the market activity at a given timeframe were dominated by the buyers. Also, a typical bullish candlestick body have the open price, close price and low and high shadow. The close is above the open signifying that the buyers pushed the price upward within a given timeframe. And continuous bullish candlestick leads to an uptrend.
For instance
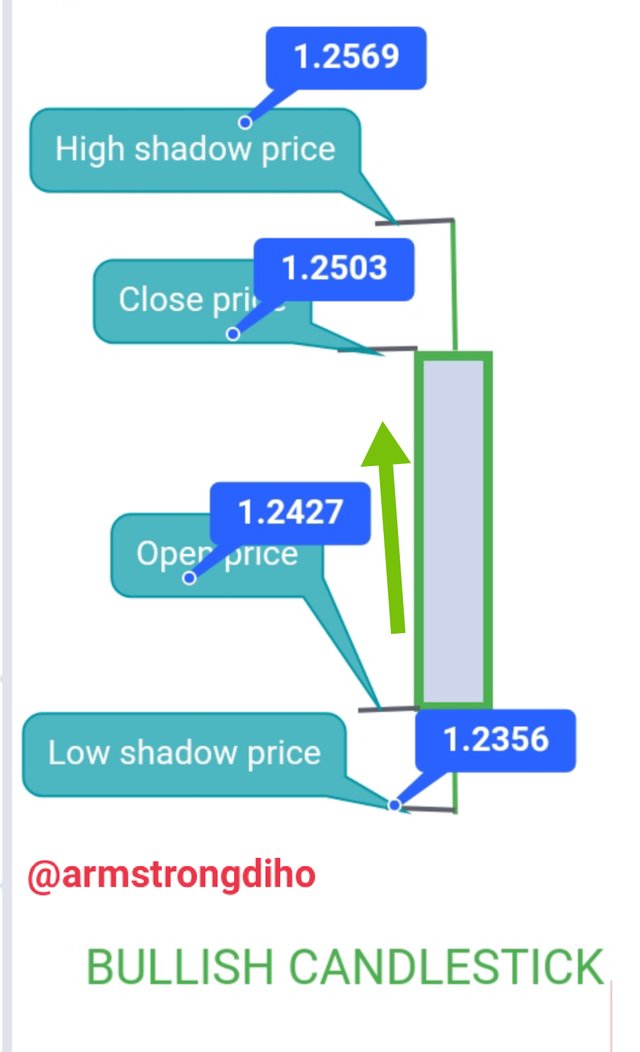
Hence, the anatomy of Bullish candle indicate the following;
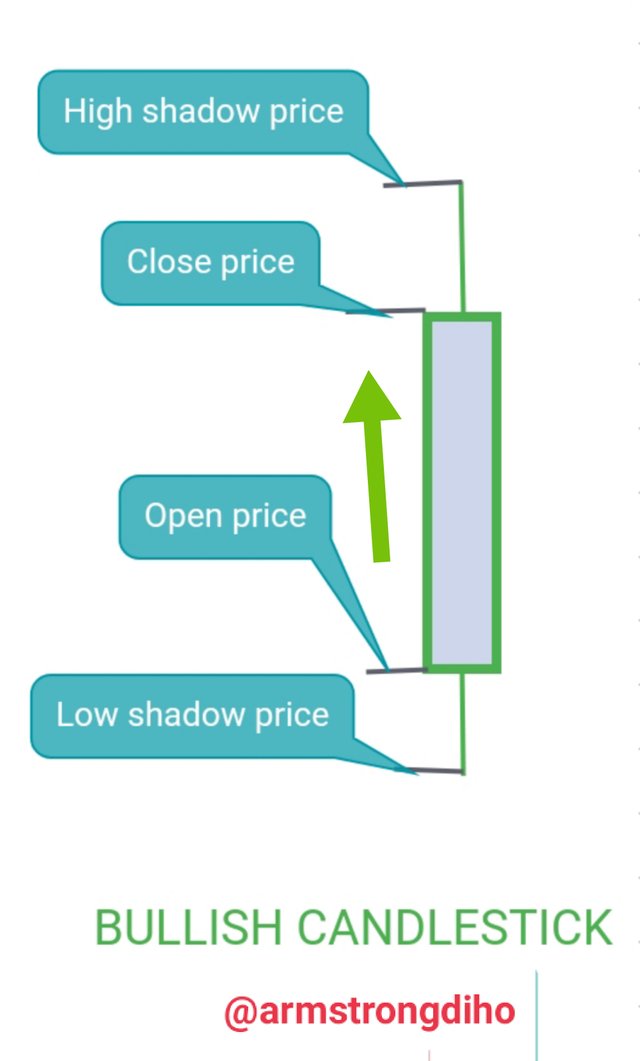
Open Price & Close Price: The closing price of the asset is always greater than the opening price.
High shadow: Indicate the asset's highest price for a given timeframe
Low shadow: Indicate the asset's lowest price for a given timeframe.
BEARISH CANDLESTICK
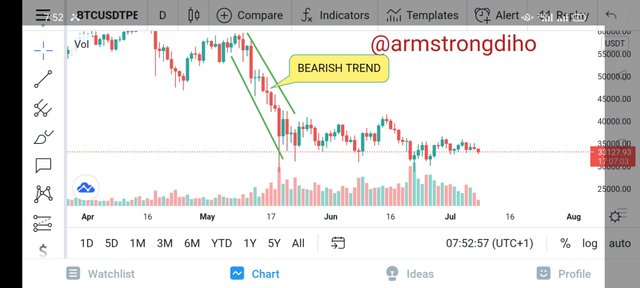
Basically in crypto space, bearish candlestick, it indicates selling pressure within a given timeframe. However, when bearish candlestick shows, it only favours traders that want to short trade their assets. With the help of the Bearish candlestick, a well savvy trader can predict the market is about to move from the uptrend direction to a downtrend direction.
Bearish candlestick most especially the one with much volume entails that the market activity at that given timeframe were dominated by the sellers.
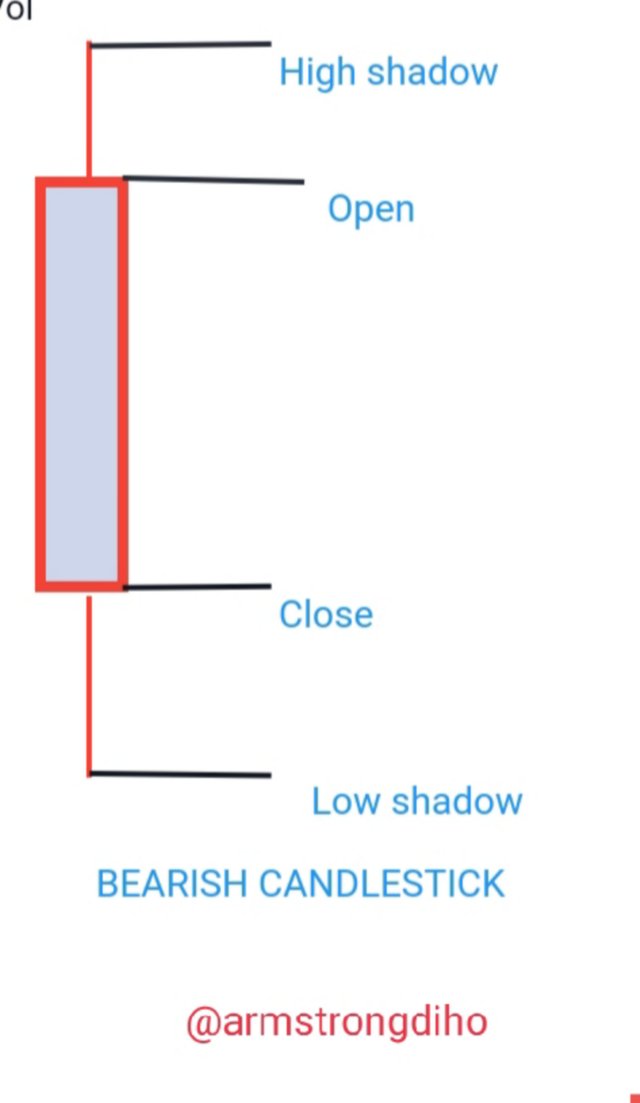
Also, a typical bearish candlestick body have the open price, close price and low and high shadow. The open is above the close signifying that the sellers pushed the price downward within a given timeframe. And continuous bearish candlestick leads to downtrend.
For Instance,
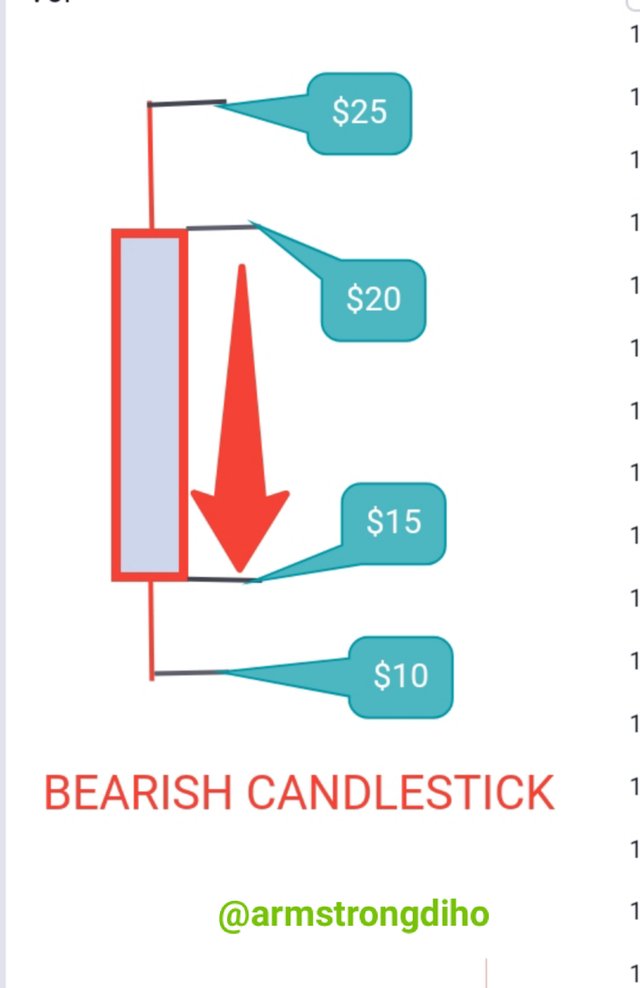
The anatomy of Bearish candle indicate the following;
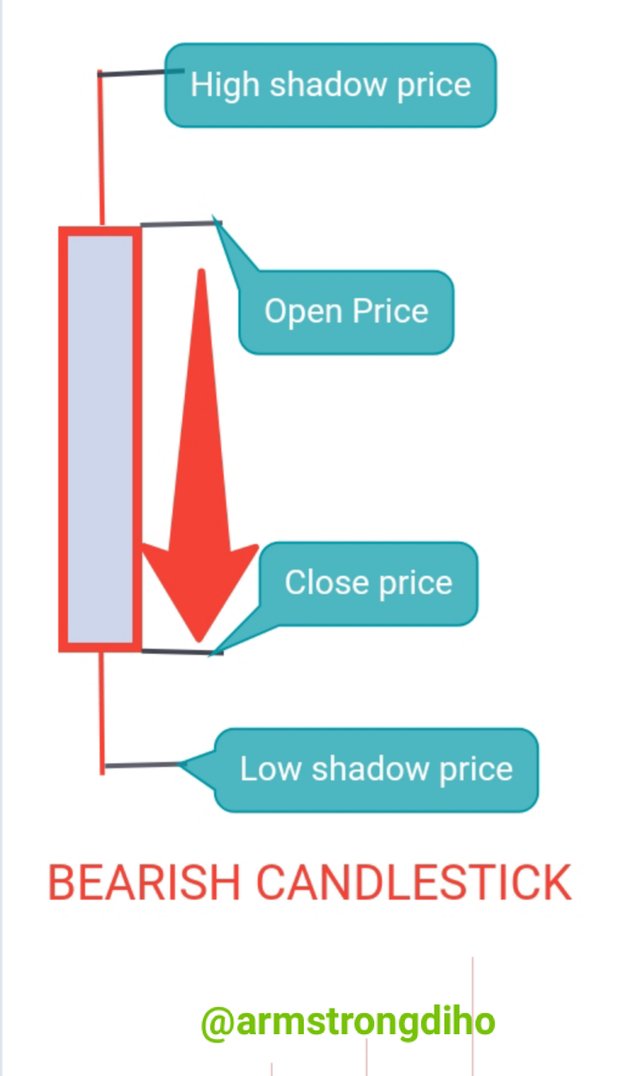
Open Price & Close Price: The opening price of the asset is always higher than the closing price.
High shadow: Indicate the asset's highest price for the given timeframe
Low shadow: Indicate the asset's lowest price for the given timeframe.
CONCLUSION
Japanese candlestick chart and other charts are very important tools technical analyst or trader can't do without because before the trader makes any trading decision must analyse the charts. For an analyst to know the set of traders that are in control of the market for a given timeframe is through the candlesticks.
However, Understanding the candlesticks charts and other charts gives the trader an advantage to minimize risk of being liquidation and maximize profits. Therefore it is recommended to understand and make a thorough analysis of the candlesticks charts before placing either long or short trade.
Thanks for reading through
Cc; @reminiscence01
🔥 The PrivacySwap Referral Program.🔥
🎬Watch the video on how the program works. 🥳https://bit.ly/3jBbeLX
📲Discuss, have fun, and let the potential of $PRV blast on the whole universe. 💥💥
🔹Official Website: https://privacyswap.finance
🔹Telegram: https://t.me/PrivacySwap
🔹Whatsapp Helpdesk: https://chat.whatsapp.com/I3LHjMVq2T30kNOJwrVZF9
🔹Medium: https://privacyswap.medium.com
🔹Twitter: https://twitter.com/PrivacySwap
Hello @armstrongdiho, I’m glad you participated in the 2nd week of the Beginner’s class at the Steemit Crypto Academy. Your grades in this task are as follows:
Recommendation / Feedback:*
Thank you for participating in this homework task.
Thanks so much Prof.@reminiscence01 for your great review.