Crypto Academy | Season 3 - Week 2 - Homework Post for @cryptokraze
INTRODUCTION

In crypto trading, analysing market structure and volatility of assets are two vital strategies traders worth focusing to maximize profits. However, one unique thing about market structure is that when trends are been identified and analysed, it gives the trader a better picture to forecast the future prices and potential changes in trends.
1 - What do you understand about Market Structure?
Naturally, when there's gravitational pull of the moon, ocean will rise and falls along a shoreline. This concept can be applied also in crypto space, where the movement of price of assets rise and fall within given timeframe creating swings points as a result of the volatility nature in crypto market.
However, Market structure is simply the activity or the price movement of the market within specific timeframe, which result to a specific pattern. This price movement always move in a particular pattern creating swing points (swing high and swing low) and support and resistance levels. Once these levels have been created, traders then make trade decision based on their analysis in these levels most especially when the levels tested twice, these now enticed some trader to make a move.
Basically, the market structure is a key method to define trends. That's traders who understands the basic knowledge about market structure can easily identify trends, as such can predict trend reversals. However, there is no perfect methodology that can identify a trends reversal.
These price movement are grouped into 3 directions which are; uptrend, downtrend and sideways trend, but I will be concentrating on uptrend and downtrend.
MARKET STRUCTURE FOR UPTREND
From the image below, we can see how the price movement is moving in an upward pattern.
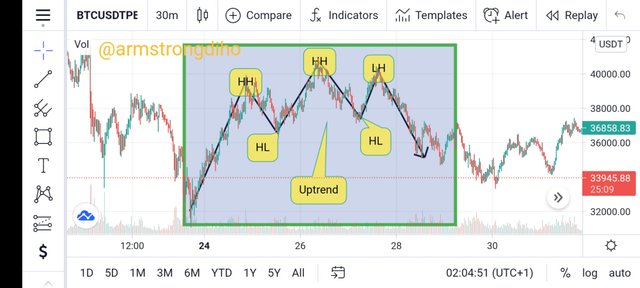
Basically, uptrend market structure simply consists of swing points; higher high and higher lows where the first swing high and low respectively will be below the second ones.
Identifying uptrend swing points is very important because it shows a trader a clearly picture of break of market structure. And when a trader identified it earlier, it will then serve as an indicator that a change of trend like downtrend may take place.
So a market is said to be in an uptrend when a higher low is able to maintain it's upward movement as such creating higher highs
MARKET STRUCTURE FOR DOWNTREND
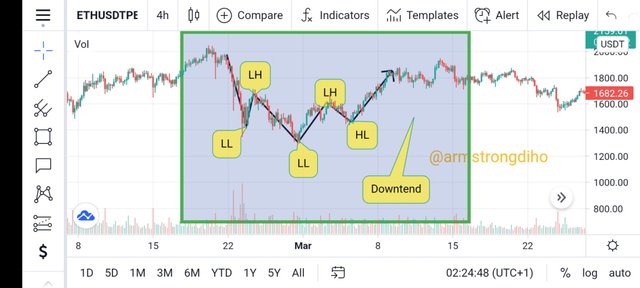
The downtrend is basically consist of swing of lower highs and lower lows, where the first swing lows and highs respectively will be above the second ones.
Identifying downtrend swing points is very important because it shows a trader a clearly picture of break of market structure. And when a trader identified it earlier, it will then serve as an indicator that a change of trend like uptrend may take place.
Hence, a market is said to be in a downtend when the higher low fails to maintain it's upward direction and falls lower which then creates lower low.
2 - What do you understand about Lower High and Higher Low? Give Chart Examples from Crypto Assets.
Market movement consist of four key swing points which are as follows;
- HH – Higher high ✓ uptrend
- HL – Higher low✓ uptrend
- LL – Lower low✓ downtend
- LH – Lower high✓ downtrend
These swing points are confusing and some how hard to identify as a beginner trader. Well I identify mine by zooming out from the chart.
HIGHER HIGH
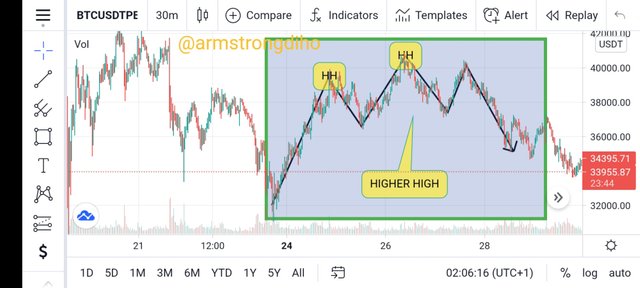
This is when the market is in an uptrend direction, which then form a next higher, that has traded higher than the previous swing high. One unique concept about this swing is that the most next high always becomes the higher high.
It is very perfect to wait for the swing highs to be tested twice or more and the next swing point can be created when there are 2 to 3 candlesticks closed to the last swing high. From the Image above i have pointed out the higher highs, you will see that the next high is higher than the last one.
HIGHER LOW
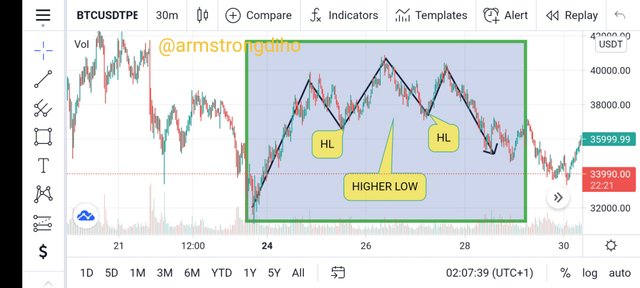
Price of an asset can observe higher lows in an uptrend. So when the market is in a uptrend direction, which forms a swing low that is higher than the previous swing low.
LOWER LOW
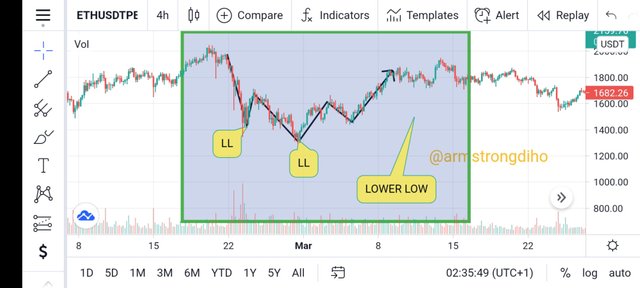
Lower low is a downtrend swing point that is formed when the market falls to a swing low that is lower than the last swing low.
LOWER HIGH
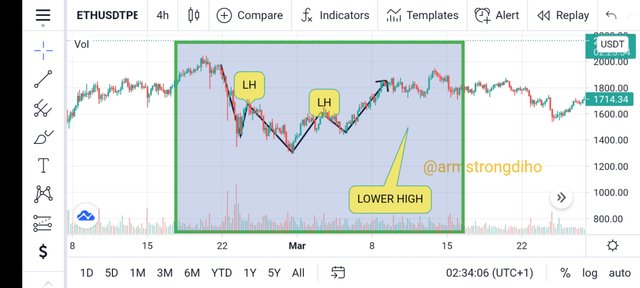
Lower high is observed in a chart where the market reverse from an upward movement to a downward direction. The concept is that the lower high is always created below previous swing high point.
3 - How will you identify Trend Reversal early using Market Structure Break?
The ability to identify trend reversal early is very important because it gives a trader an advantage to maximize profits. Although it requires time and experience to identify trend reversal.
Hopefully, with the help of break of market structure it might be easier most especially when you understand the swing points. However, break of market structure leads to trend reversal which can be uptrend or downtrend.
IDENTIFY UPTREND REVERSAL EARLY
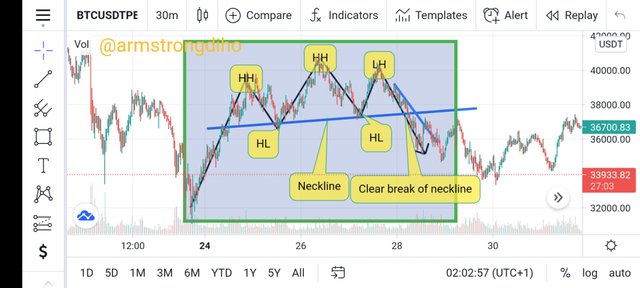
A perfect uptrend should have a good much larger higher highs move and little higher lows. Once a trend start becoming weak at a point where the higher highs starts reducing, which then will result to formation of lower high at the top. Once an uptrend test twice or more, the next is to mark out the neckline of the market structure, and then wait for the neckline to breakout which then gives you the confirmation that an early uptrend reversal will take place.
All these give a clear picture when the uptrend will reverse and immediately there might be occurrence of downtend. And the next is for the trader to make a trading decision.
IDENTIFY DOWNTREND REVERSAL EARLY
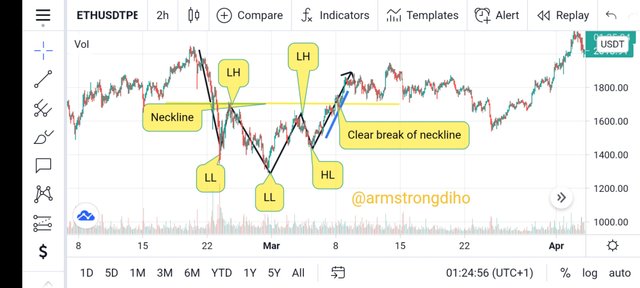
A good downtrend must have a good much larger Lower lows move and little low highs. Immediately the lower lows becomes weak, there will be a formation of higher Low at the Bottom of the downtrend which then shows an uptrend transition. Once the downtrend have tested twice or more, the next is to mark out the neckline of the market structure.
All these give clear picture when the downtrend will reverse which will then lead to transition of uptrend. But to get more confirmation, is to wait and observewhen there will be clear break of neckline. The next is to make a trading decision. This is to say that Identifying trend reversal early is a better strategy to achieve a big profit and as well minimize risk.
Explain Trade Entry and Exit Criteria on any Crypto Asset using any time frame of your choice (Screenshots Needed)
I will be explaining buy and sell entry and Exit criteria based on MSB strategy.
Buy entry criteria
A clear downtrend must break structure. This happens when the previous swing point is cleared. In the case of downtrends, we have lower highs and lower lows. So, when price action clears a previous lower high, a break of structure has occured.
For the break of structure to occur, another thing should be noted: "The volume or momentum" this involves the impulsive move that breaks the structure. There has to be volume or momentum in the bullish candles that break structure.
The 4hr time frame is my best suit. Once a break of structure has occured on this time frame, I mark the demand zone and also mark out the bullish order block which is the last bearish candle before the move that broke structure.
Note;
The move that breaks structure should have volume or momentum.
Once that demand zone or order block has been marked, I wait for price to approach the order block.
Once price has approached the order block, I can take a trade using the initial bearish order block, or I wait for a MSB on the much lower time frames. 30min, 15min, 5min and even the 1min time frames become important for me to make my decision.
Once there is break of market structure on these time frames to reconfirm my buy entry, I take the trade and set my tp accordingly. I usually employ the 1:3 risk to reward ratio.
Sell entry criteria
- A clear uptrend must break structure. Higher highs and higher lows make up the uptrend and we have a break of structure when a previous higher low or a swing low has been cleared out by bearish price action.
- The bearish move that breaks structure has to have volume or momentum as well.
- Once a MSB has occured, I mark the supply zone or the bearish order block (which is the last bullish candle before the bearish move). The 4hr time frame is also my focus here.
- Once the supply zone or order block has been marked, I set my entry and wait patiently for price to approach the zone. This is a somewhat aggressive approach.
- Another approach which is somewhat conservative is waiting for a MSB on the lower timeframes: 30min, 15min, 5min TFs.
- Once there's a break of bullish structure on any of these timeframes, I enter with an order block on that lower timeframe. This refines my entry better and gives me a better RRR.
5 - Place 2 demo trades on crypto assets using Market Structure Break Strategy. You can use lower timeframe for these demo trades (Screenshots Needed)
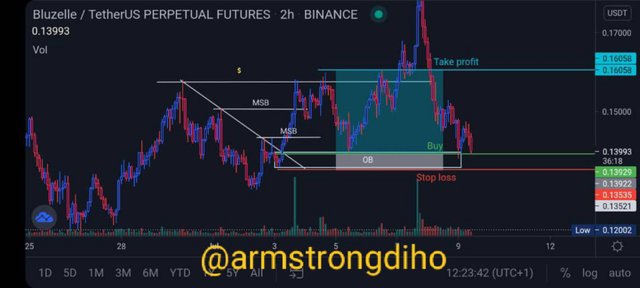
The three trade I had this week, two hit my take profit but couldn't hit my entry and it was really painful. Looking at the chart you can see is an uptrend . After I observed the break of market structure, I waited until it the neckline break out and I knew it will reverse back then I made my trade decision. It was really a nice shot but didn't hit my entry.
However, the last trade hit my entry and my take profit.
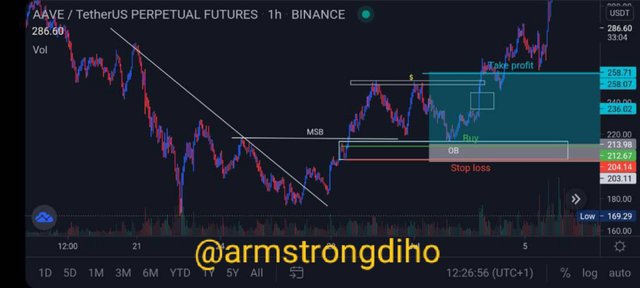
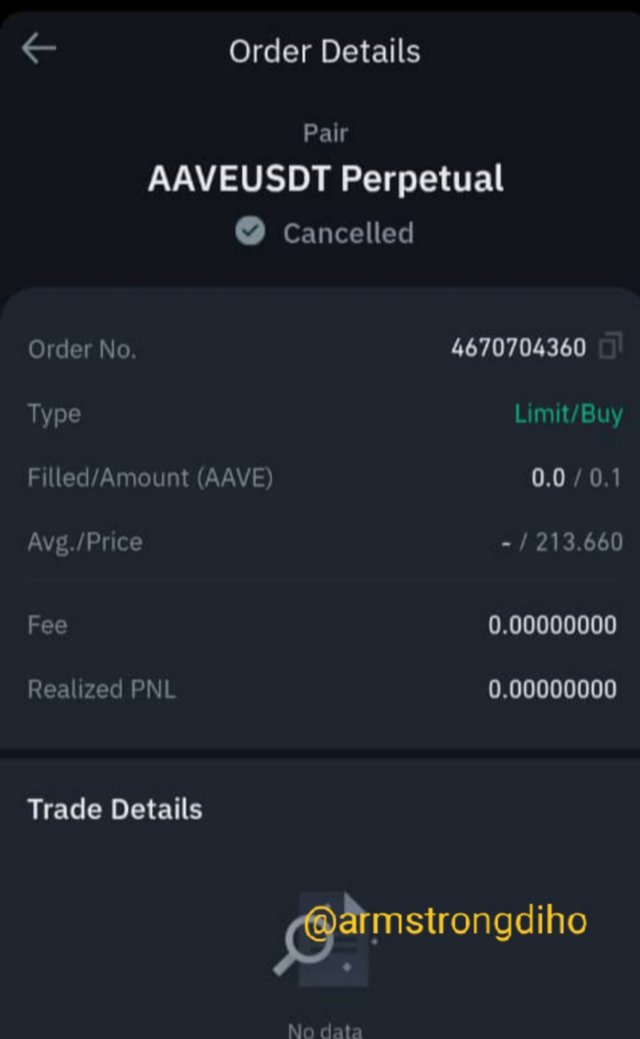
First Trade AAVE/USDT Order 1h timeframe
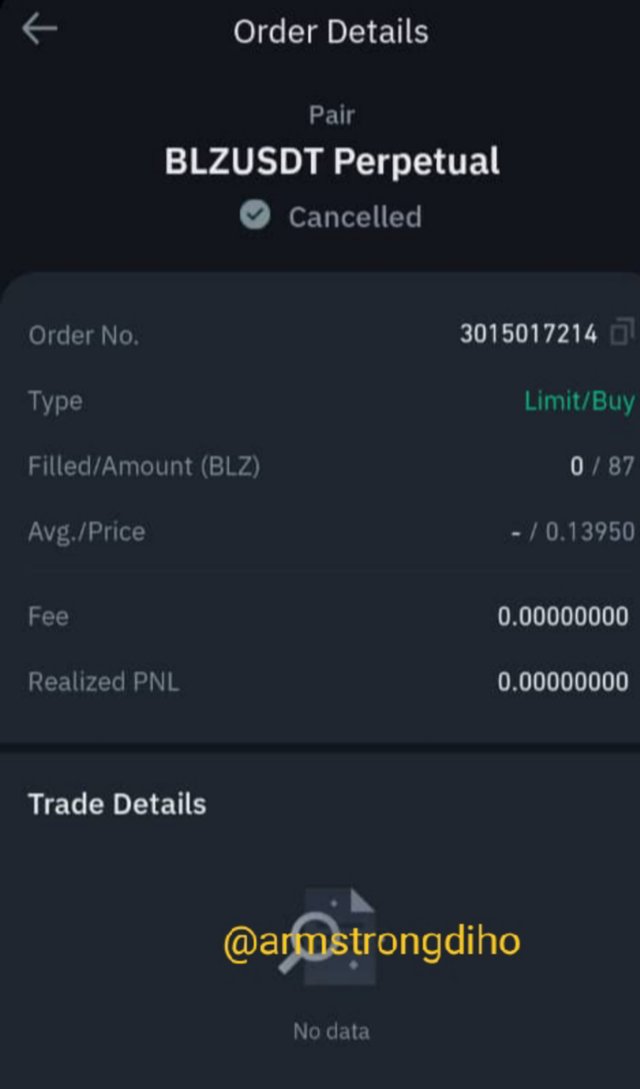
Second Trade BLZ/USDT 1h timeframe
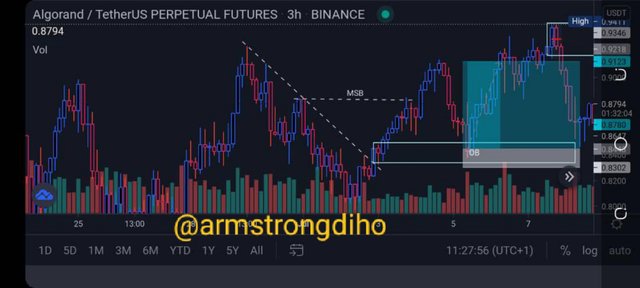
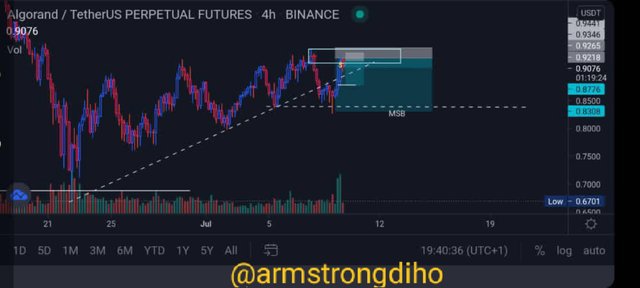
3rd trade ALGO/USDT 1h
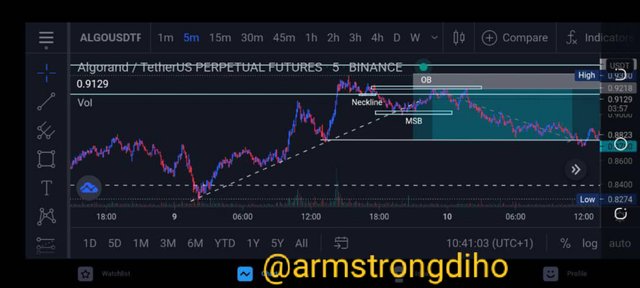
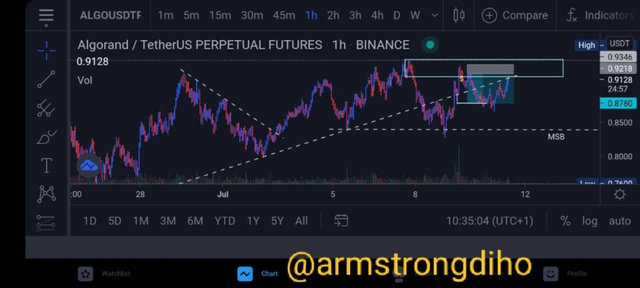
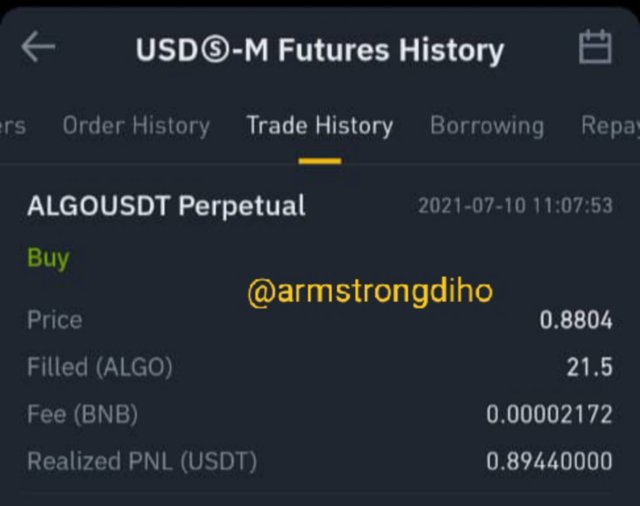
On multiple time frames, ALGO broke structure. Starting from the 4hr time frame which I normally use, it broke structure from an uptrend. I came down to the 1hr time frame and got a bearish order block. I marked the zone with a volume profile marker (the red line). And I waited for price to approach the supply zone (bearish order block).
Once price approached the order block, I scaled down to the lower time frame. 5min to be specific and I waited for a MSB. Once market structure broke as indicated, I then marked the 5min bearish order block, and set my entry. My trade was triggered in minutes and I set a reasonable target using risk to reward ratio (RRR) of 1:3
In a few hours, my trade hit take profit
CONCLUSION
Having knowledge about Market structure is very important and worth focusing. So Identifying and marking out the swing points( lower highs, lower lows, higher highs, and higher lows) on your charts are very important because it shows you a clearly picture of break of market structure. When once a trader identified it very early , it will then serve as an indicator that a change of trend may take place. Then gives the trader a good approach to enter the market.
Cc; @cryptokraze