Support and Resistance Breakouts - Crypto Academy / S6W3 - Homework post for pelon53.

1. Explain in detail the advantages of locating support and resistance on a chart before trading.
I will like to first define support and resistance zone.
Support Zone is a level in the trading chart where the price stops to continue going down as a lot of buyers come together to push the price upward. You can draw the support zone by ensuring that the horizontal line touches at least 2 or more of the wick or candlestick which are in the zone.
Resistance Zone is a level in the trading chart where the price stops to continue moving up as sellers put forces together to shift the price downward. You can draw the resistance zone by ensuring that the horizontal line touches at least 2 or more wicks or candles that are noticeable in the zone.
The advantages of locating support and resistance on a chart before trading.
Locating the support and resistance on a chart helps you to see the possible entry point and exit point. The support and resistance when drawn accurately help you as a trader to know the appropriate time and point to enter the market and also gives a clue of where to place your stop loss and take profit as well.
Locating the support and resistance on a chart helps you to identify the zone of supply and demand in a chart. And finding the supply and demand zone will help in giving an insight of where there will be a reaction in price move, therefore, helping the trader to know the right time to buy and when to sell.
Locating the support and resistance on the chart helps you to build a good risk management strategy because the exit point is usually below the previous support or resistance in the chart while the take profit is also around above the previous support or resistance in the chart as well. So this helps to make sure that our capital is well protected.
2.- Explain in your own words the breakout of support and resistance, show screenshots for the breakout of resistance, use another indicator as a filter.
Breakout of resistance is a point in the chart where the price moves above the resistance zone either to continue the movement in the uptrend or to retrace back to the resistance line before bouncing to the uptrend.
When the price continues to move up after breaking the resistance level, it gets to a point above the resistance where it retraces, and that becomes your entry point as a trader before the price continues its upward movement.
When the price breaks the resistance and retraces back to the resistance, it starts moving up and you take your entry point in the same level with the higher high of the break-out candles and the price continues moving up from there.
Below is a screenshot of breakout of resistance. I used the Relative Strength Index as my indicator.
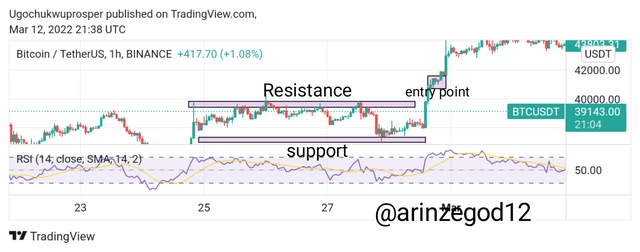
Source: Tradingview
3.- Show and explain support breakout, use the additional indicator as a filter, show screenshots.
Breakout of Support is a point in the chart where the price moves below the support zone either to continue the movement in the downtrend or to retrace back to the support line before it continues its downward movement.
When the price continues to go down after breaking the support level, it gets to a point below the support where it retraces, and that becomes your entry point as a trader before the price continues its downward movement.
When the price breaks the support and retraces back to the support line, it starts going down again and you take your entry point in the same level with the lower low of the break-out candles and the price continues going down from there.
Below is a screenshot of breakout of support. I used the Relative Strength Index as my indicator.
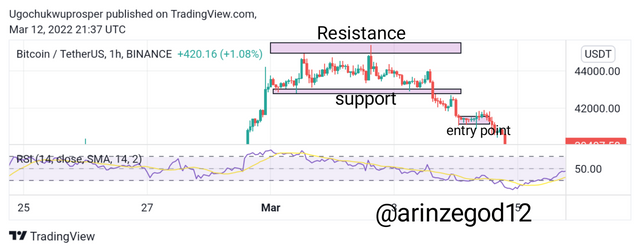
Source: Tradingview
4.- Explain what a false breakout is and how to avoid trading at that time. Show screenshots.
A false breakout is a situation where the price breaks the range zone(support and resistance) but later moves in an opposite direction to the initial break out thereby leading to losses of funds for traders. This can be a confusing and devastating state in the market which requires absolute carefulness by the trader to avoid loss of capital in an attempt to trade the breakout.
To avoid false breakout while trading, it is advisable to wait for the full formation of the candlestick that makes the breakout and then possibly wait for a retracement and then wait also till it gets to the level of the breakout candle before you enter the trade. Then you can use other indicators like Relative Strength Index, Volume, Moving Average etc to confirm your analysis before entry as well.
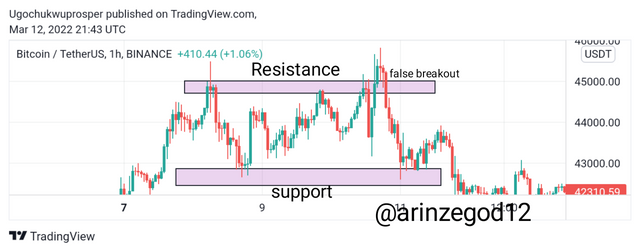
Source: Tradingview
5.- On a demo account, execute a trade when there is a resistance breakout, do your analysis. Screenshots are required.
I analyzed the XRPUSDT pair in the Crypto market. I drew my support and resistance line. The price has broken the resistance line and retraced so I entered the trade as it is moving up again in uptrend. Below is the screenshot of my analysis with my Demo trade execution in my metatrader 5 application.
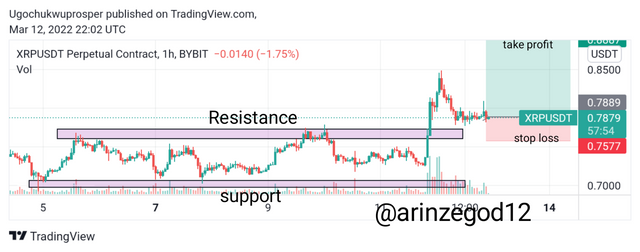
Source: Tradingview
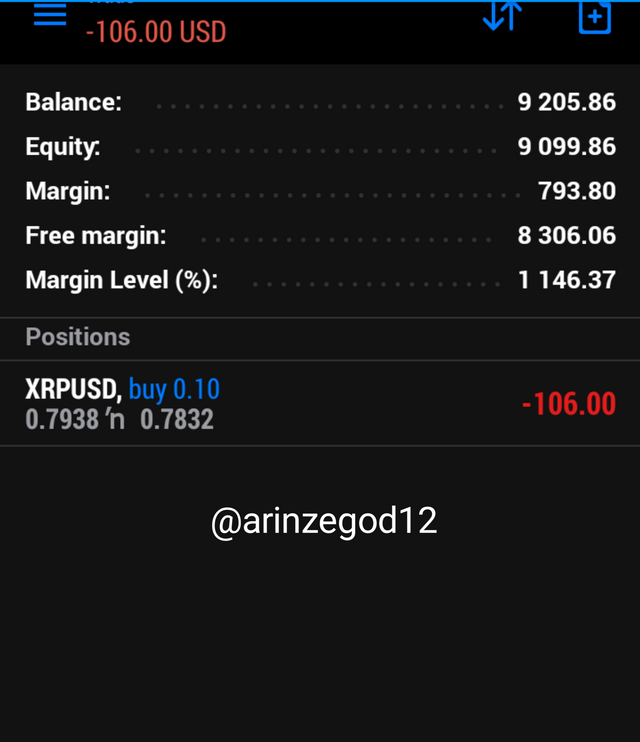
screenshot from metatrader 5
6.- In a demo account, execute a trade when there is a support break, do your analysis. Screenshots are required.
I analyzed the MATICUSDT pair in the Crypto market. I drew my support and resistance line. The price has broken the support line and retraced so I entered the trade as it is going down again. Below is the screenshot of my analysis with my Demo trade execution in my metatrader 5 application.
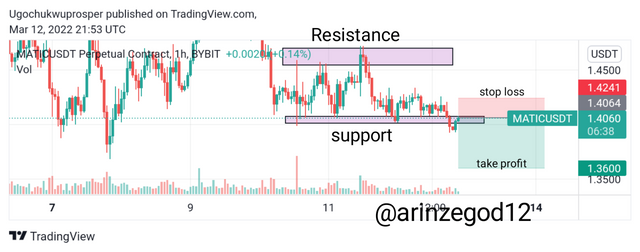
Source: Tradingview
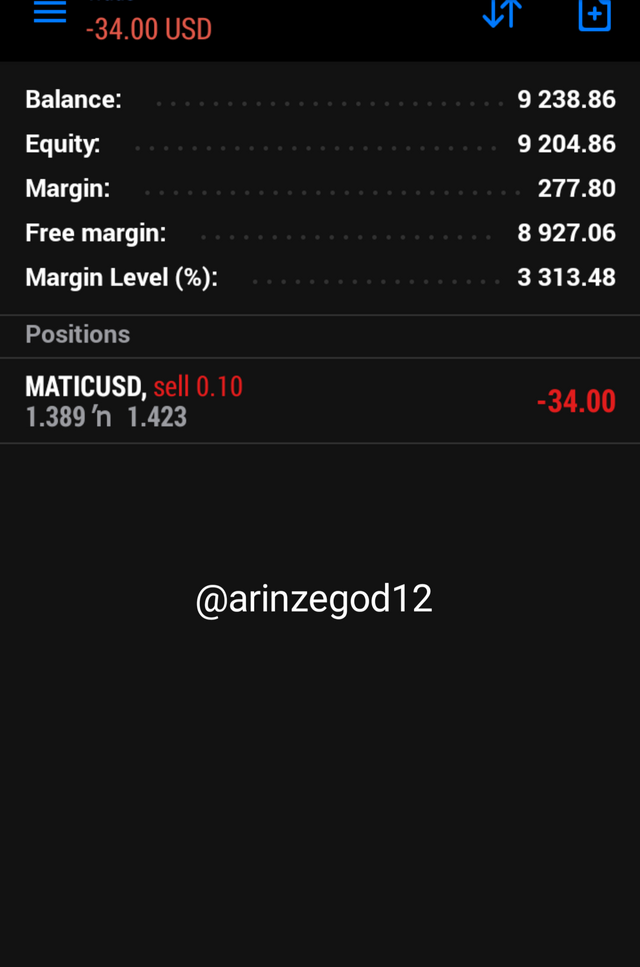
screenshot from metatrader 5
Conclusion
Understanding Support and Resistance is a key to making the best profits and minimizing your losses in the Cryptocurrency market. I have learned everything I need to know about support and resistance breakout which will aid my understanding of the Cryptocurrency financial market.
I wish to especially thank prof @pelon53 for these interesting lectures. I hope for another wonderful one next time.