Trading Using Rectangular Pattern - Steemit Crypto Academy - S5W4 - Homework Post for @sachin08
Greetings to everyone, this another week of the crypto academy and my first post for this season. In this week’s lesson, the topic was about Trading using rectangle pattern and it well explained by our noble professor @sachin08. Now I would like to go straight ahead and attend to the assignment that was given.
 Image designed with Canva
Question 1: Explain Rectangle Pattern in your own word.
Over the previous lessons we have learned a lot about chart patterns and market strategies that will help us to perform proper technical analysis in the crypto space. This week there has been an introduction of the Rectangle Pattern and this new pattern/observation is important to many investors in the market.
The Rectangle pattern is simple a shape that is formed in the chart of an asset understudy that shows the current market state of the asset. Normally, the asset are supposed to be trending in either uptrend or downtrend but in the case of the rectangle pattern, it can only be formed when the market is not trending. That is to say, there is side by side movement causing a steady market price of the asset.
In addition, with the Rectangle pattern the asset moves in between a particular range and falls back over a period of time until the is a trend breakout. This type of market trend movement is termed as ranging. Meaning, the rectangle pattern forms when the asset in the market is ranging.
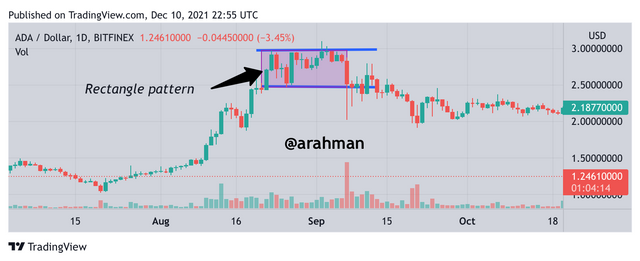 Chart of ADA/USD from TradingView
The upper line of the rectangle is identified as the resistance levels while the bottoms line is the supports levels. The trend movement falls between these lines causing causing a steady price movement of the asset. After a trend breakout happens, the market may either move in an uptrend or downtrend.

Question 2: How to identify Rectangle. Explain with Screenshots.
It very easy to identify any Rectangle pattern in a chart of any asset. The first thing that should be observed is whether the market is ranging, if the movement is ranging then you can go on to identify the rectangle pattern.
The formation of this pattern can be done by drawing your support and resistance lines to clearly indicate the rectangle. To do that, you have to make sure the market prices bounces of and falls back to a particular level of resistance and support. This is to help you confirm if the market is ranging.
Next thing to do is to support two higher-highs and two lower-lows from the resistance and support levels. Then make sure to draw a a Trendline through these two points. After drawing the two horizontal lines, the rectangle pattern will clearly shown in the chart.
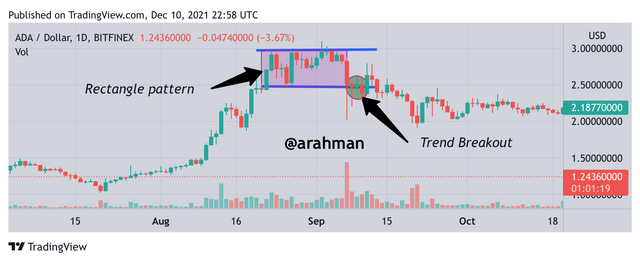 Chart of ADA/USD from TradingView
It is necessary to make sure that any of the horizontal lines of resistance and support lines are not breached in order to identify correctly, the rectangle pattern.

Question 3: Can we use indicators with this pattern to get accurate results? Explain with screenshots.
Yes we can use indicators with the rectangle pattern to gain accurate results. It very necessary to combine at least two strategies or techniques/indicators when performing technical analysis in order to yield more accurate and reliable results. We know that the use of indicators are very important and with the help of these indicators, the rectangle pattern can be more reliable and efficient to use in technical analysis.
For example, I would like to use RSI indicator together with the rectangle pattern when performing technical analysis. The RSI indicator will help me to confirm any trend movement that has been detected by the rectangle pattern. The RSI indicator will help me to identify the trend breakout that will happen after the formation of the rectangle pattern.
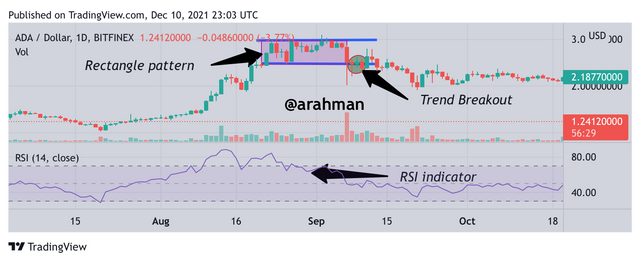 Chart of ADA/USD from TradingView
In the chart above, I have applied the RSI indicator with the rectangle pattern and the analysis have been made. From the RSI indicator immediately the RSI value is above 70 it means that there will be a bullish trend and when it is below 30 then there will be a bearish trend. This helps me to pre-determine the next trend breakout after the rectangle pattern.

Question 4: Explain Rectangle Tops and Rectangle Bottoms in your own words with screenshots of both pattern
With regards to the rectangle pattern, the position at which it is formed on the chart is very important and after which market trend it is formed is also necessary as to how it can be classified. It can be classified into two forms; Rectangle Tops and Rectangle Bottoms.
Rectangle Tops
This position of the rectangle pattern formation usually happens when there has been a bullish trend for a period of time then. It appears at the top or in other words, at the end of the bullish period. After the uptrend movement, the Rectangle pattern is formed at the top until there is a trend breakout.
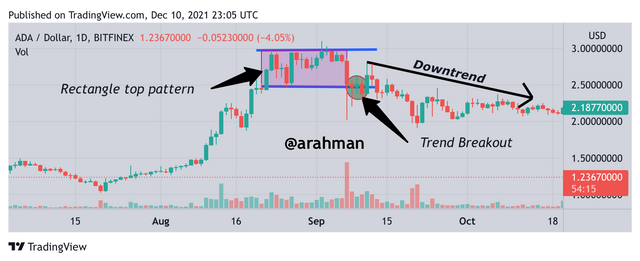 Chart of ADA/USD from TradingView
Most at times, the trend breakout after the Rectangle top is in downward direction. This means that, there is a bearish breakout after a rectangle top formation.

Rectangle Bottom
Similar to the rectangle top, the vice versa is what we call the rectangle bottom. This is because, the rectangle bottom pattern forms when there has been a bearish run and it is formed below the downward trend, marking the end of a downtrend.
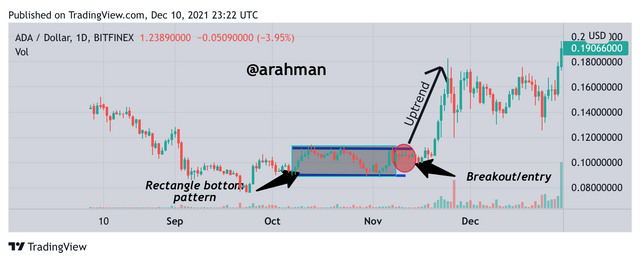 Chart of ADA/USD from TradingView
The trend breakout after the rectangle bottom is usually a bullish trend and this means that the market trend moves downward. In some cases, the rectangle bottom may be a signal for traders to exit the trade and place sell orders.

Question 5: Show full trade setup using this pattern for both trends. (Entry point, Take profit, Stop loss and breakout)
Buy Trade Setup For Rectangle Bottom Pattern
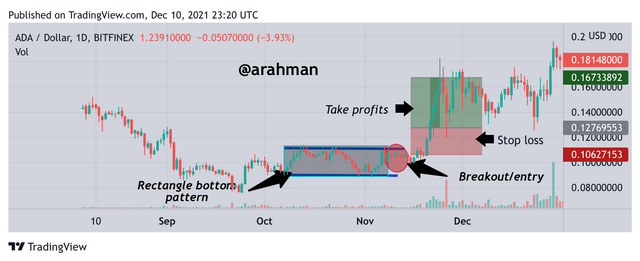 Chart of ADA/USD from TradingView
The chart above shows ADA/USD, and the rectangle pattern can be spotted clearly on the chart. In the case of setting up a buy trade, we look out for a Rectangle Bottom Pattern. In the chart, the rectangle bottom pattern is spotted. It can be observed that the movement is trending between the upper and lower lines of the rectangle. After a while, there’s a breakout point signaling for a buy order to be placed. Then the market moves to an uptrend, meaning a bullish run can be expected. Time to set take profits and stop loss after placing the buy order.

Sell Trade Setup For Rectangle Bottom Pattern
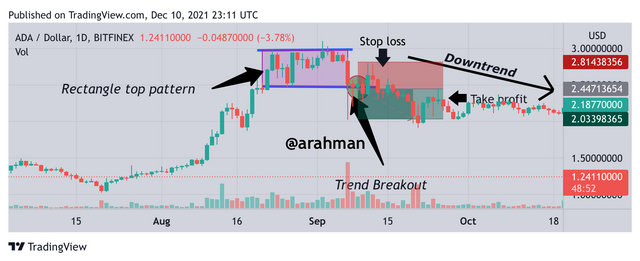 Chart of ADA/USD from TradingView
The chart above shows ADA/USD, and the rectangle pattern can be spotted clearly on the chart. In the case of setting up a sell trade, we look out for a Rectangle Top Pattern. In the chart, the rectangle top pattern is spotted. It can be observed that the movement is trending between the upper and lower lines of the rectangle. After a while, there’s a breakout point signaling for a sell order to be placed. Then the market moves to a downtrend, meaning a bearish run can be expected. Time to set take profits and stop loss after placing the sell order.

Conclusion
Generally I believe that the study of market patterns are very useful to predict trend reversal and trend breakout in the market. The rectangle pattern is also another pattern observation that is useful in technical analysis.
Also it is always necessary to confirm the results of these pattern observation with at least two indicators in order to make the analysis more accurate and reliable. The rectangle pattern can not be fully reliable just like other indicators and patterns.
Finally, I want to thank the professor @sachin08 for sharing this new pattern formation with us. I wish to learn more from our next lessons.