Trading strategy with RSI and ICHIMOKU]- Steemit Crypto Academy- Homework post for Professor @abdu.navi03
 Edited with Canva
Hello everyone, this is another week of the crypto academy. In this week lesson, the topic discussed by professor @abdu.navi03 is Trading strategy with RSI and ICHIMOKU and this is my entry post for the assignment tasks given.

Put your understanding into words about the RSI+ichimoku strategy.

Over our previous lessons in the crypto academy, we have learned that indicators that are used in technical analysis are not 100% reliable and accurate. It may sometimes produce false signals and this is why it is always necessary to combine two indicators in a chart in order to produce more accurate analysis.
This is why we will be talking about the usage of the RSI + Ichimoku Strategy over here. Now as we all know, the RSI indicator is used by traders to spot the overbought and oversold regions of the market. The overbought region is a portion on the chart which indicates that there has been too much purchasing of the asset causing a rapid price increase of the asset. Also the overbought signals signals for a long uptrend in the price movement of the asset.
However with the oversold region, it indicates on the chart of the asset that, there has been hard sales made on the asset causing a rapid decrease in the price of the asset. This shows a long downtrend in the price movement of the asset and it also signal for a trend reversal from bearish to bullish trend.
With the RSI indicator, the signals may sometimes be false because there is no indication of the volume in the market and sometimes too, it doesn’t work perfectly with ongoing trends. This is why we will use the RSI alongside this Ichimoku indicator to improve our analysis, thus produce a more reliable and accurate technical analysis.
The Ichimoku indicator helps traders to identify momentum, support, and resistance levels all in one chart of asset. This as a results helps investors to spot trend changes in the chart. The Ichimoku indicators also may sometimes produce late signals and this is why we combine its usage with the RSI indicator in order to perform a better technical analysis.
RSI+Ichimoku strategy a very reliable strategy in technical analysis which helps traders to identify trend signals on the chart very fast. As a result, traders are able to establish good market positions and make more profits from the market. By using these two indicators at once, traders will be able to filter out false signals and help us predict potential bearish and bullish trend signals in the market.

Explain the flaws of RSI and Ichimoku cloud when worked individually

Flaws of using RSI individually
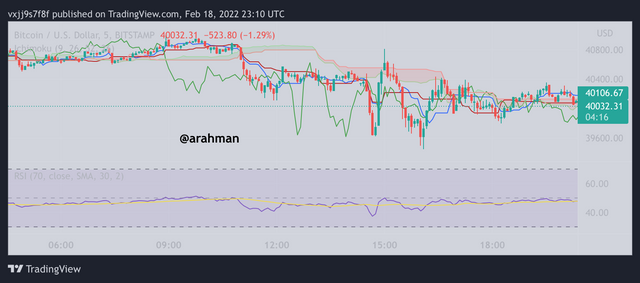
The Relative Strength Index, RSI indicator as I already mentioned is very useful in technical analysis but it may sometimes produce false signals. With the RSI indicator it is expected that when the RSI line exceeds the 70 mark, it is in an overbought region. This means that there are many buyers of the asset in the market and hence a strong bullish period is expected in the price movement. But sometimes the RSI may produce this overbought signal while the market may reverse back to moving in a downtrend.
In some other cases, the RSI indicator may produce late signals which may cause indicators to miss out bullish period to make profits from the market. What this means is that, the RSI can sometimes signal for an uptrend/downtrend whereby in reality the trend has change over a period of time in the chart.
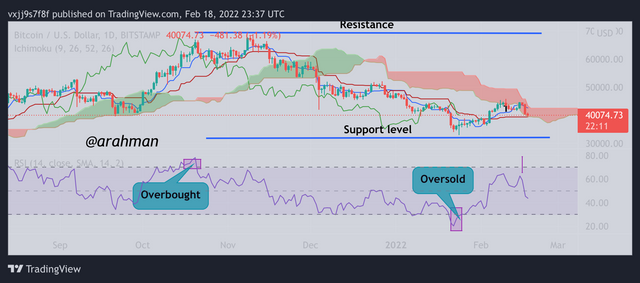
In the chart above, we can notice that the RSI is showing an overbought region and hence a signal for an uptrend should be expected. But in reality, the market trend of the asset shifts to a downtrend. Also we can see that in some part of the chart, the RSI gives a late signal of uptrend/downtrend and this is why it cannot be fully reliable for conducting technical analysis.
Flaws of using Ichimoku individually
Even though the Ichimoku indicator is widely used by most traders it is also just like other indicators, it has its own flaws. The most common disadvantage of the Ichimoku indicator is that, it may sometimes produce late signals and for traders to make profits from the market, they have to spot market trends fast so as to establish good entry and exit positions. But in the case of using the Ichimoku it may sometimes delay signals from the market. For example, the indicator may show an uptrend but in reality, the market is in its last stages of the uptrend and heading to a downtrend. This will cause investors to miss out on the bullish period to make profits. The Ichimoku is not suitable to be used in ranging markets.

Explain trend identification by using this strategy (screenshots are required).

The combination of the RSI and Ichimoku indicator can help investors spot correct market trend in price movement of an asset. When the RSI indicator mover over the 70 level, it forms an overbought region signaling for an uptrend in the chart. But we can not rely on this information completely so we validate this information by comparing with the Ichimoku indicator.
We can confirm the signal from the Ichimoku indicator if the price movement of the asset falls above the Ichimoku clouds. This also signals for an uptrend, hence the RSI signal has been confirmed.
With trend identification for a downtrend, the RSI indicator should fall below the 30 mark, and this shows an oversold region in the RSI signaling for a downtrend in the price movement of the asset. The confirmation of this signal can be done with the help of the Ichimoku indicator.
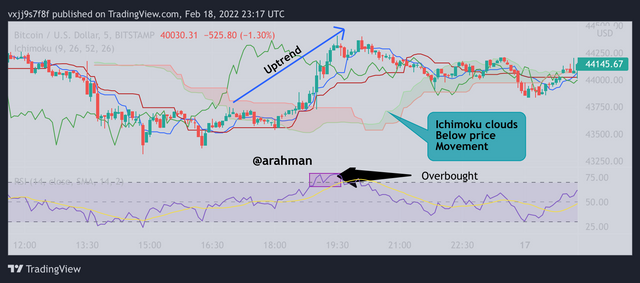
When the price movement of the asset falls below the Ichimoku clouds, it is considered that the market is moving in a downtrend and hence this confirms the downtrend signal from the RSI.

Explain the usage of MA with this strategy and what lengths can be good regarding this strategy (screenshots required)

Also we can improve our technical analysis by adding the Moving Averages indicator to the RSI+Ichimoku strategy. This will further help give more confirmation of our trend signals.
With this demonstration I prefer to use a length of 100 in the moving averages indicator. To spot trend signals with the moving average indicator, look out for when the MA line falls when there is price movement in the chart. When the price movement is above the MA indicator, it signals an uptrend but when the price movement is below the MA indicator, it signals a downtrend.
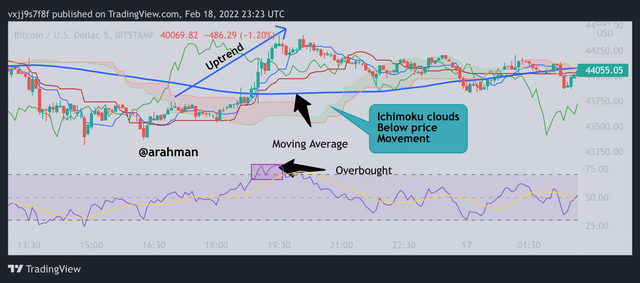
Using the MA of length 100 together with the RSI+Ichimoku strategy, the market is in an uptrend when the price movement is below both the MA line and the Ichimoku clouds while the RSI is in an overbought region. Also the market is in a downtrend when both MA line and Ichimoku clouds is above the price movement of the asset while the RSI indicator is in an oversold region.

Explain support and resistance with this strategy (screenshots required)

In the case of identifying both support and resistance levels of a chart, we use the Ichimoku clouds to spot support and resistance when the market is trending and the RSI indicator to spot support and resistance when the market is in sideways movement. These two work together to spot support and resistance in any market conditions.
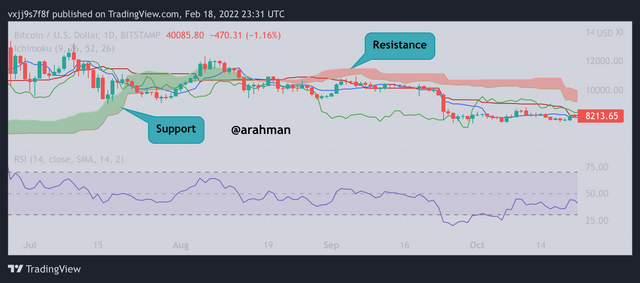
When the market is trending, we can easily identify the support and resistance with the help of the Ichimoku clouds. The support level in the chart is identified by a green color which falls below the price movement of the asset. The resistance level of the asset is spotted when the clouds are red and falls above the price movement.
However, when the market is moving sideways, we use the RSI to detect support and resistance. The overbought region in the RSI is traced to the chart and hence our resistance level is identified. Also the oversold region in the RSI Indicator marks the support level of the asset. And this method is applied when the markets moves sideways.

In your opinion, can this strategy be a good strategy for intraday traders?

In my opinion I think the RSI+Ichimoku strategy is a very useful strategy and can be used by intraday traders. It combines RSI and Ichimoku clouds to help traders spot market trends in the chart. This opens a path for the traders to establish good market entry and exit positions.
Also with the help of this strategy, traders will be able to identify the support and resistance of the asset in any kind of market condition, be it a trending market or sideways market. This information is very useful for traders to make profits from the market.
One thing to note is that, users of this strategy may try to use this strategy alongside other indicators in order to acquire more accurate analysis, but this solely depends on how comfortable one is with the RSI+Ichimoku indicator.
So basically, I would say that the RSI+Ichimoku strategy is very useful for intraday traders since it helps them to pick up trend signals in both trending and sideways markets. It is essential for traders to establish good market positions and this can be achieved with the help of the RSI+Ichimoku strategy.

Open two demo trades, one of buying and another one of selling, by using this strategy

Buy trade
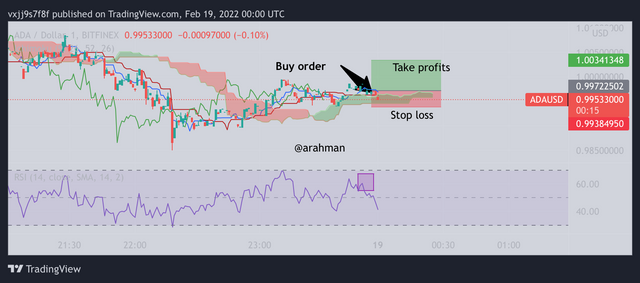
From the chart above, I have applied the RSI+Ichimoku to the chart of BTC/USD. We observe that the RSI is nearly in the overbought region which signals for an uptrend. The Ichimoku clouds forms green below the price movement which confirms the uptrend signals. So I placed my buy order while I added stop loss and take profits.

Prove of Trade

Sell Trade
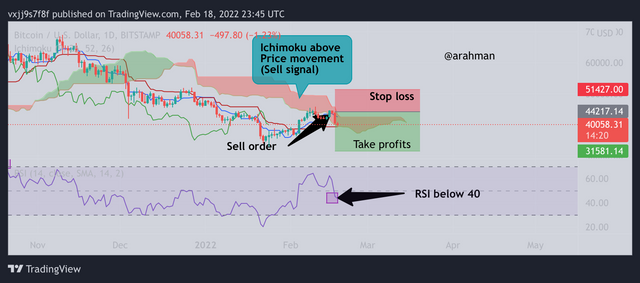
From the chart above, I have applied the RSI+Ichimoku to the chart of BTC/USD. We observe that the RSI is nearly in the oversold region which signals for a downtrend. The Ichimoku clouds forms red above the price movement which confirms the downtrend signals. So I placed my sell order while I added stop loss and take profits.

Prove of Trade

Conclusion

RSI indicator is very useful indicator to determine strong market trends of an asset and the Ichimoku clouds also helps to identify trends in the market. But with the combination of these two indicators, we can form a more power tool for technical analysis and this is called the RSI+Ichimoku strategy. It helps traders to also spot good market entry and exit positions in order to benefit from long bull periods and Bear periods.
To further improve the usage of the RSI+Ichimoku strategy, users can also decide to add another indicator to make sure they acquire a reliable results from the technical analysis.
Thank you professor @abdu.navi03 for this interesting lesson and I hope to learn more from you.

All screenshots are taken from TradingView 