[Crypto Trading with Price Action] - Crypto Academy / S6W2- Homework Post for @reminiscence01
 Edited with Canva
Hello everyone, this is another week of the crypto academy where we have learned about Crypto Trading with Price Action. This lesson was prepared by professor @reminiscence01 and this post is my entry for the assignment tasks given.

Q1.Explain your understanding of price action
Before traders execute a trade, their main aim is to gain a lot of profits from the trade and this is why these traders carry out their analysis in order to make proper market decisions. It should be noted that one cannot rely on just information acquired from fundamental analysis but rather, it is highly recommended to perform technical analysis before making market decisions.
With the help of technical analysis, traders will be able to acquire useful information such as support, resistance and market trends and this will help influence their market decisions positively. Performing technical analysis will also help traders to discover Price Action of an asset which also helps the trader to reduce manage risk and setting up trades.
The usage of Price Action strategy can help us to establish good market entry and exit positions in the market. As a result of this, it will help traders to gain more profits from trades while they reduce their losses. Another importance of using this strategy is that, it helps traders to study and determine the market condition/structure before making trades. We are able to understand why the market is currently in that state or why the chart shows a particular pattern. For example, when the market is in uptrend, it means that there are buyers than sellers that are being made in the market. And when the price movement is in downtrend, it shows that there are more selling of the asset ongoing than buyers in the market.
Also, price action helps traders to read the volume of the asset under study in the market and to determine good stop loss limits and take profits limits in the market. With all this information obtained, the traders can spot market trends such as bearish movement and bullish movement.
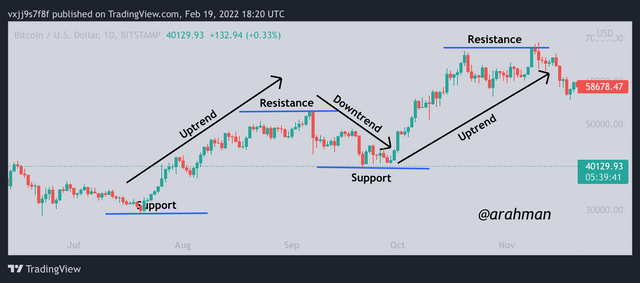
In the chart above, we can observe that immediately the price movement touches the strong support line, there is a trend reversal from downtrend to an uptrend. Also, from the chart after the price movement touches the strong resistance level, there is trend reversal from an uptrend to a downtrend. These information acquired from price action helps us to set up market entry and exit positions that we can benefit from.
Q2.What is the importance of price action? Will, you chose any other form of technical analysis apart from price action? Give reasons for your answer.
As I mentioned earlier, it is very necessary to perform technical analysis before setting up any trade in the market. With the help of price action, it comes with so many benefits. I will be discussing some of the importance of price action below:
Traders obtain information such as market conditions, resistance and support levels in the chart of an asset. This helps traders to identify proper market entry and exit positions from the information obtained in the analysis.
Also, traders are able to spot market trends and potential trend reversals in the chart of an asset. This also positively influenced the market decisions of many traders into making more profits from trades while they reduce/manage their risks from trades.
Due to the raw price movement in the chart of price action, investors can rely a lot on the market trend and analysis. This is because, the noises and false signals are filtered out leaving a more accurate information for traders.
From the above explanation of the importance of price action, I believe that price action is very reliable source of technical analysis and without it, there would be more risk involved when trading.
Without price action it would be very difficult to predict potential market trends and hence making good market entry and exit positions would be difficult as well.
Q3.Explain the Japanese candlestick chart and its importance in technical analysis. Would you prefer any other technical chart apart from the candlestick chart?
In performing technical analysis, it is required that the trader has some knowledge about reading the price movement of a chart. There are some different types of chart/graph such as Bar Chart, Line Chart, Heikin Ashi, Hollow candles and the to be talked about is The Japanese Candlesticks chart.
 source
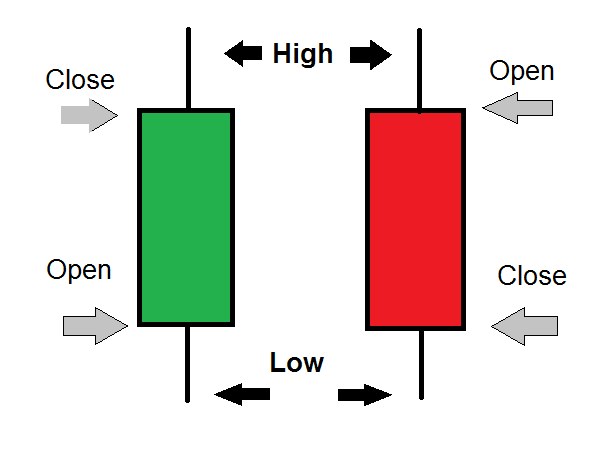
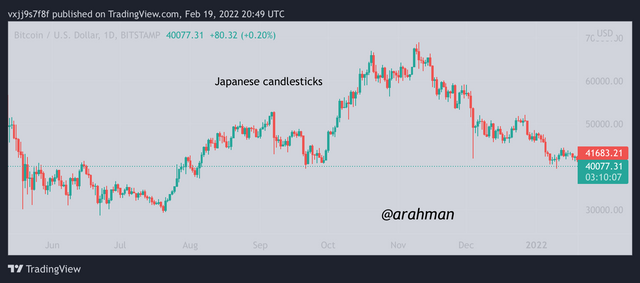
Japanese Candlestick Chart Is a type of chart which focuses more on the demand and supply in the market of the asset. Each candlesticks in the chart contains information of High, open, close, low prices over a period of time. With the help of these information in the candlesticks, most expert traders are able to use Break Retest Break (BRB) and the (MSB) strategies to perform technical analysis.
When there is more demand, it means that the buyers are in control of the market and this usually shown with massive green candles in the chart. Consequently, where there is more supply than demand, it means there are more sellers In control of the market and this is seen with massive red candles in the chart.
Would I prefer any other chart pattern?
In my opinion, i would value the Heikin Ashi Candles also when performing technical analysis. My reason is that, it is a very useful price chart which reveals market trends very easily as compared to other price charts.
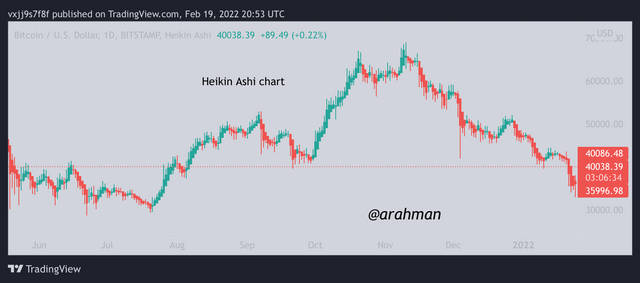
From the chart above, we can clear see market trends in the chart with massive red and green portions on the chart. The preceding green candles represent uptrend while the preceding red candles shows downtrend. For this reason, I would suggest this price chart to perform technical analysis especially when identifying market trends.
Q4.What do you understand by multi-timeframe analysis? State the importance of multi-timeframe analysis.
Multi-timeframe analysis involves the usage of multiple/different timeframes on a chart to perform technical analysis. It helps traders to determine potential market trends and also spot exact market entry and exit points.
Also, we can use Multi-timeframe analysis to spot the directions of market and use it to our advantage. We can adjust the timeframes accordingly to our style of trading and this will help traders make good market decisions.
Traders who are interested in setting up long positions may adjust timeframes to a longer period and traders who adopt the style of scalp trading may also adjust the timeframe to a short period.
Generally, for scalp trading it is advisable to use a timeframe between 5 to 30 minutes. This will help the trader to establish proper market entry points.
Importance of Multi-timeframe analysis
Multi-timeframes analysis helps traders to identify trends in the price movement before setting up entry and exit positions. Also the traders get to understand the true nature and conditions of the market in order to execute successful trades.
Also traders are able to eliminate false signals or wrong signals from the chart since the analysis will be performed on different timeframes. The comparison of a shorter time frame and a long timeframe gives the investors accurate and reliable signals before performing trade actions. In short, multi-timeframe helps reduce the noises in the market.
With the use of multi-timeframe analysis the risk involved in trading is cut short or it may even be eliminated. This is because, trends identified in longer timeframe can be compared with that of a short timeframe and when the results are satisfactory, the trader can go ahead to execute a trade.
Q5.With the aid of a crypto chart, explain how we can get a better entry position and tight stop loss using multi-timeframe analysis. (You can use any timeframe of your choice).
Trade Entry Using Multi-timeframe Analysis
Before we execute a buy trade, it is necessary to identify the current market structure/condition. This helps us to spot the trend in the market, and this can be achieved by setting the timeframe to a longer period. After identifying the market structure, we can now set the timeframe back to a short period and execute our buy trades. Also it is beneficial to set up stop losses and take profits and other to mange the trade risks.
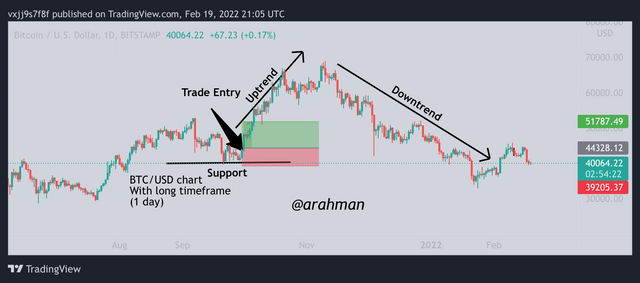
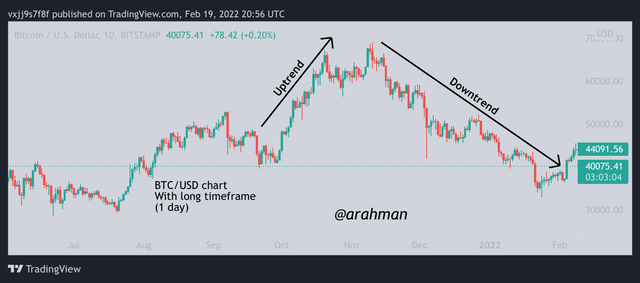
The chart above shows BTC/USD with a timeframe of 1 day period. From the chart, we can clearly spot the support and resistance levels of the price movement. Also this helps us to identify the trend and of the movement and breakout points. We can confirm the bearish and bullish signals with a shorter timeframe.
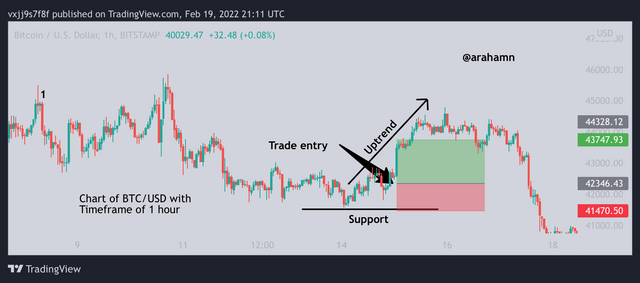
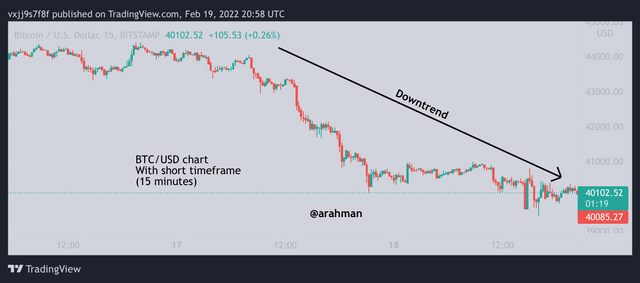
In the above chart of BTC/USD in shorter timeframe of 1 hour, the support and resistance levels have been identified. Also this helps to spot the market trend and price movement of the asset. We can now set up trade entry points from the analysis. Finally, set up my stop loss just near the support level and take profits higher above the support level.
Q6.Carry out a multi-timeframe analysis on any crypto pair identifying support and resistance levels. Execute a buy or sell order using any demo account. (Explain your entry and exit strategies. Also, show proof of transaction).
For this demonstration, I will be using the ADA/USDT pair and I will analyze and perform a trade.
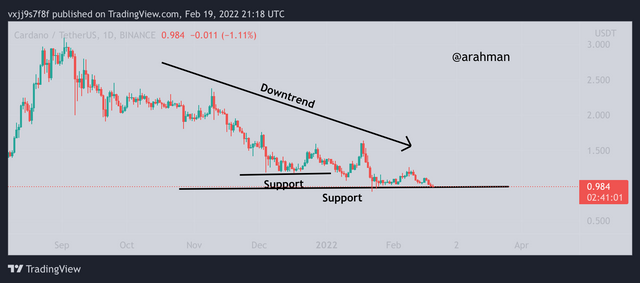
In the chart above, the timeframe is set to 1 day. This helps me to analyze and gain knowledge about the structure of the market. I have been able to spot the support and resistance levels in the chart. From the chart, it is observed that the price movement has broken the support level and it is heading towards continuation of downtrend.
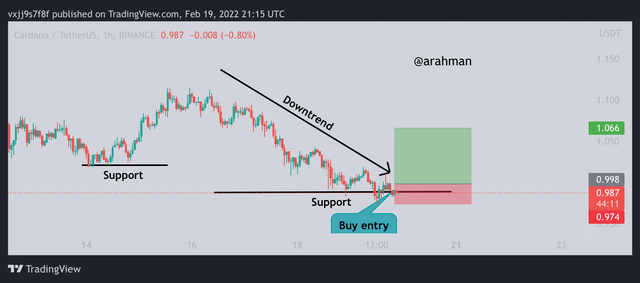
Now I perform another analysis but this time around, with a short timeframe of 1 hour, we can observe that there was a fake signal created in the first chart. The chart above shows price movement breaking support line upwards. This calls for a buy signal, so now I set up a buy trade and insert a stop loss just below the support level and also add take profits.
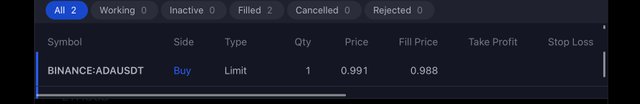
Prove of demo trade
Conclusion
Price action revels several information in the price movement of an asset. Traders are able to spot market trends and manage risk in trading with the help of price action. Also information of support and resistance levels in the chart helps improve technical analysis of traders and this creates a chance to establish good market entry and exit positions.
The Japanese candlesticks chart, takes into account the supply and demand of an asset in order to correlate the actual price of the asset in the market. This type of chart is widely used by many trades to perform technical analysis.
Thank you professor @reminiscene01 for giving us this interesting lessons and I hope to learned more from you.
All unsourced images are screenshots taken from TradingView website.