[ Crypto Trading with Moving Average ]-Steemit Crypto Academy | S6W2 | Homework Post for @shemul21
 Edited by Canva
Hello everyone, it’s another week of the crypto academy season six. This weeks lesson was about the topic Crypto Trading with Moving Average and the professor behind this lesson is @shemul21. This is my entry for the assignment that was given after the lesson.
Explain Your Understanding of Moving Average.
In the life of a Cryptocurrency trader or investor, it is very essential to perform technical analysis in order to improve market decisions for a successful transaction/trade in the crypto market. These are the reasons why most traders use indicators in the market chart of an asset to detect trend signals and market trends.
Now, Moving Average indicator is one of the most popularly and widely used indicator by many traders to perform technical analysis. The Moving Average indicator just as other indicators, is used to predict or identify the price movement of an asset on crypto charts by taking into consideration the market trend of the asset.
The moving average indicator appears on the chart of an asset in the form of a string of line that follows the price movement of that asset. The principle behind the operation of this indicator is that, it determines or calculate the average price movement of an asset over a period of time. With this, it helps to filter out market fluctuations and noises to give a clear trend in the chart. Moving average indicator helps traders to identify when the market is in an uptrend, downtrend of sideways trend (balance of uptrend and downtrend causing the steady price movement of the asset).
The moving average indicator is also a tool that traders use to identify potential support and resistance levels, and this ensures that traders make the correct market decisions. This tool helps traders to understand the market trend or potential trend reversal and to study the uptrend, downtrend and sideways movement of the asset. The moving average indicator can be used with little knowledge of technical analysis, thus both beginners and experts are suited to use this type of indicator.
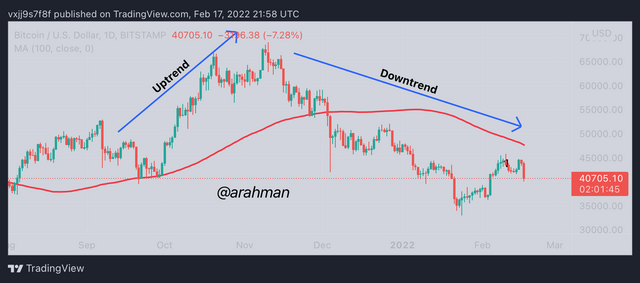
The above chart shows a sample application of the Moving Average indicator. It clearly indicates the current market trend of the asset and it shows that the asset is in an .

What Are The Different Types of Moving Average? Differentiate Between Them.
As I said earlier, the moving averages indicator is very essential to traders in performing technical analysis. There are three types of this Moving Average indicator of which I will talk about next.
- Simple Moving Average (SMA)
The Simple Moving Average indicator is considered the simplest of the three MAs. With the SMA it considers just the average prices of the asset over specific timeframe. The SMA plots on the graph dynamically as the averages are calculated when the price movement changes subsequently.
The SMA helps traders to spot market trends in the chart of an asset so as to enhance proper market decisions. When the SMA line falls below the candlesticks price movement, it means the market will move in an uptrend but when the SMA line falls above the candlesticks price movement, it means that the market will shift to a downtrend.
There is a formula/equation used to calculate the averages of the SMA. It is demonstrated below:
Where; A = the average of the asset over a certain period.
n = number of periods taken in view of calculations( example; 30 days period)
- Exponential Moving Average (EMA)
The Exponential Moving Average, is another type of a moving average indicator which is similar to that of the SMA in their way of functioning. The development of the EMA is to enhance the performance of the SMA and hence it requires more understanding in order to be able to use this type of Moving Average.
The EMA takes into consideration also the current price movement of the asset making it very fast to yield a more accurate results from the analysis. This is one feature/ability that makes it differ from the SMA since the SMA takes into consideration both previous and current price movement of the asset. In relation to the SMA, the EMA predicts market trend at a higher and faster rate than that of the SMA.
Just like the SMA, the EMA also has its own calculations and it is demonstrated below:
Where;
EMAc = the Current EMA,
Cp = the Current price of the asset,
EMAp = the previous day EMA,
s = the Smoothing factor,
n = the Period (number of days).
- Weighted Moving Average (WMA).
The Weighted Moving Average is the last moving average indicator to talk about and with this type of moving average indicator, it considers mostly the current price of the asset with little usage of the previous asset price data. With the WMA, it is capable of giving spotting the future market trend than that of the SMA, and this is because it focuses solely on the current market price data of the asset. It also has its own calculations which is shown below:
Where; n = the Period(number of days)

| SMA | EMA | WMA |
|---|---|---|
| SMA indicator shows average prices over a specific period | EMA focuses more on the current price data than the previous price over a period of time | WMA indicator focuses on the current prices and just a little of the previous prices. |
| SMA is the slowest in spotting trends | EMA is faster than SMA in spotting trends | WMA is also faster than SMA in spotting trends |
| SMA is most suitable for a longer term of trading | EMA is more reliable for short term trading, because it focuses on current price data | WMA is more suitable for short term trading and scalping |
| SMA is advantageous with a longer timeframe | EMA is advantageous with a short timeframe | WMA is advantageous for both short and long timeframe |
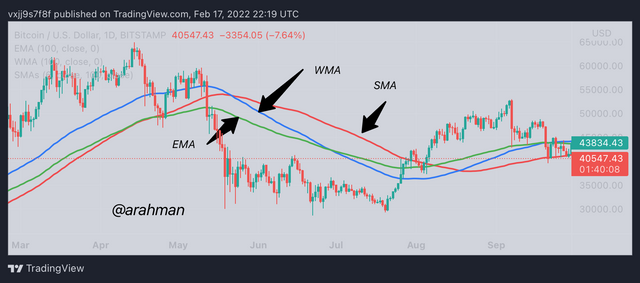
The chart above shows the application of all the three types of moving averages indicator. It can be seen clearly that the SMA indicator reacts slowly to the price change and so the indicator is a bit away from the price of the asset. In addition, the EMA indicator is however seen closer to the price of the asset just as the WMA since they react faster to price change of the asset.

Identify Entry and Exit Points Using Moving Average. (Demonstrate with Screenshots).
Identifying Entry Positions With Moving Average.
The Moving Average indicators are mostly used to determine market trends of an asset and as a result, identify entry points in the market. It is always recommended to combine two or more indicators to acquire accurate and reliable analysis. With this, I will be using the SMA indicator with 100 Period and the EMA Indicator with 20 period.
The EMA can be seen as green while the SMA seen as Red. For a trader to make a market entry, the asset must be in an uptrend. For this indicators, when the market is trending above both the SMA and EMA, it means the market is an uptrend. Also, when the EMA(green) crosses over the SMA(red) it indicates an uptrend hence, signaling for market entry.
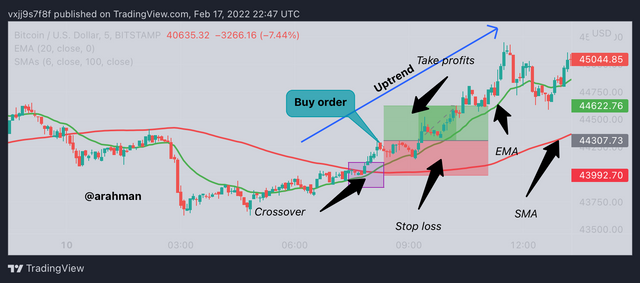
In the chart above, I observed that the market was trending below the two moving averages, so I waited for a trend reversal before making a market entry. Immediately the EMA fell above the SMA, it signals for a trend reversal. So I placed my buy order and added take profit and stop loss.

Identifying Exit Positions With Moving Average.
With the exit positions, the same principle/idea can be applied. So first of all I added the SMA and EMA indicators. The EMA can be seen as green while the SMA seen as Red. For a trader to make a market exit, the asset must be in an downtrend. For this indicators, when the market is trending below both the SMA and EMA, it means the market is a downtrend. Also, when the SMA(red) crosses over the EMA(green) it indicates a downtrend hence, signaling for market exit.
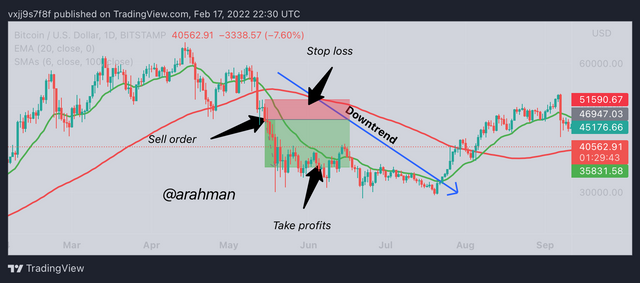
In the chart above, I observed that the market was trending below the two moving averages, so I waited for a trend reversal before making a market exit. Immediately the SMA(red) fell above the EMA(green), it signals for a trend reversal. This means that the market is shifting to a bearish trend So I placed my sell order and included take profit and stop loss.

What do you understand by Crossover? Explain in Your Own Words.
Crossover is a term which is used to define the combination of two types of Moving Average indicators in one single chart. The principle of this crossover is hugely defined by the point of convergence between the two moving averages that have been used. Crossover can be used to determine or spot trend breakout/reversal and to identify potential market entry and exit positions. The two moving averages used is usually a slow moving average and fast moving average. Most the EMA and the SMA are the most used moving averages in the crossover principle.
When using the EMA and SMA, the trader looks out for the convergence point where by the EMA (fast moving averages) crosses over the SMA(slow moving average) to indicate an uptrend or bullish trend. This significantly signals for traders to put in their buy orders since this signals for a market entry.
Also when using the EMA and SMA, when there SMA(slow moving averages) crosses over the EMA(fast moving averages) it indicates that there will be a downtrend or bearish trend and this signals for market exit. At this points traders establishes exit points from the market.
With the application of both the SMA and EMA with periods of 100 and 20 respectively, I would demonstrate the crossover effect with the chart below:

In the chart above, it can be clearly observed that the EMA has crossed over that of the SMA this signals for a trend reversal. Meaning, the market is shifting to an uptrend. At this point, traders are able to establish entry positions.
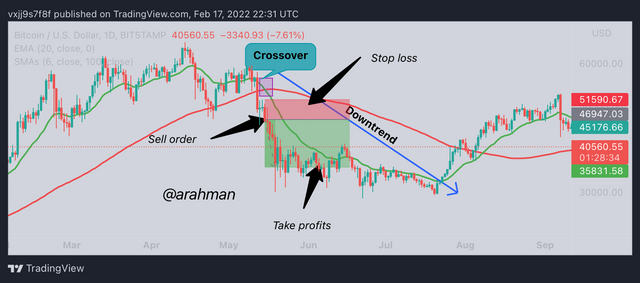
Also in this chart above, we can clear see that the SMA has crossed over the EMA and this signals for a downtrend. The traders observing this can set up a sell orders to exit the market. The chart further shows a downtrend.

Explain The Limitations of Moving Average.
Now we have learned over the previous seasons and lessons that, there is no indicator that works perfectly fine on its own. This is why most of these indicators are combined with others to produce good and reliable results. Below are some of the limitations of the moving average indicator.
One thing about the Moving Average indicator is that, it works well with assets that are trending. This means the moving average indicator will perform its function when the asset is either in an uptrend or downtrend. A steady market is very hard to read using the moving average indicator.
It may produce wrong/false signals since it does not take into consideration other information other than the price data of the asset.
Due to its lagging nature, the Moving Average indicator may detect trend reversals very late which may cause traders to lose on bull/bear periods.
Changing too much of the moving averages settings may cause false signals. Adjustments of periods length with wrong timeframe maybe produce false signals.

Conclusion
The Moving Average indicator is a very useful tool in technical analysis which helps traders to spot market trends and potential entry and exit positions in the market. There are three types of Moving Averages and these are; the Simple Moving Average, Exponential Moving Average and the weighted Moving Average. Among all these, the Weighted and Exponential moving averages are very fast with regards to spotting trend signals and reversal.
Also the application of two the moving averages is called the crossover effect which helps traders to predict bearish and bullish trend in the market. As a result of this, good market decisions such as entry and the exit can be derived from the crossover principle.

All screenshots are taken from TradingView
