Crypto Academy Season 2 Week 6 Homework Post for @fendit - ||Elliott Wave Theory||
Hello guys, in this week’s lecture we have learned a lot about the Elliot Wave theory, and by reading through the lecture and also doing research I am now going to answer the homework.
What's the application of the Elliot Wave theory?
To clearly understand the Elliot wave theory’s application, you need to first understand what the theory itself is. It is a principle from technical analysis that allows as to predict the price of any cryptocurrency with the idea that markets follow a pattern in a certain period of time. This theory was founded by an individual called Ralph Nelson Elliott.
With time, the successive repetition of the market trends makes it possible for investors to predict the future change in price of the asset. In short, we are able to price forecast an asset.
The Elliot wave theory employs the use of two patterns or waves, and these are; impulsive wave and corrective wave. The pattern that moves alongside with the current market trend is called impulse wave and that pattern that moves in opposition to the current market trend is referred to as the Corrective wave.
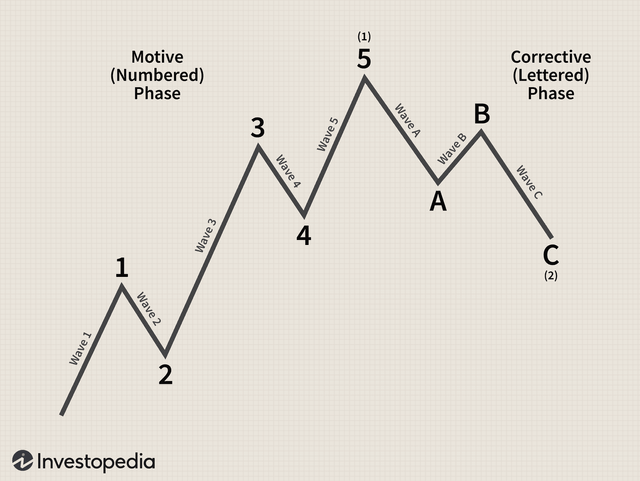
The diagram below shows the different type of waves used in the Elliot Theory.
 Source
Wave 1-5 represents the impulse wave and wave A-C represents the corrective waves.
There rules that are followed when using the Elliot wave theory;
- First rule: Wave 2 must never completely retrace back wave 1.
- Second rule: Wave 3 cannot be the shortest among waves 1, 3 and 5.
- Third rule: Waves 1 and 4 must not overlap.
Source

WHAT ARE IMPULSE AND CORRECTIVE WAVES
I will throw more light on the these two terms I have mentioned earlier in my post.
Impulse wave
As I stated earlier, these waves move alongside the market trend and they come in 5 stages as you can see in the diagram provided above and I will be explaining all these stages below.
There is downward movement in the 1st wave of a bearish period and an upward movement in the 1st wave of bullish period. The first wave usually opens a chance to enter a trade and as soon as there is a spike some profits will be made.
In wave-2, the movement is downward and upward with bullish and bearish periods respectively. And as the rule states, the second wave cannot be below that of first wave. In this case, it would have been a good time to exit the trade from the investment of wave-1 and make some profits.
Also it can be noticed in the 3rd wave of a bullish period that there will be an upward movement and a downward movement in the bearish period. There will be a vast upward direction since investors will start to buy more assets after previously selling their coins to get profits. This is why this wave is usually the longest wave and must never be the shortest.
In the 4th wave you will realize a decline in the pattern since investors who entered the trade will now decide to sell so that they can make profits.
Finally, the 5th wave usually comes with an overprice of assets due to huge bullish period or huge bearish period. It may cause recording of the smallest value in price and highest value in price of the asset.
Corrective Wave
This pattern moves in the opposite direction of the market trend and they usually small and difficult to spot. Wave A and C usually move in the same direction while B moves opposite to A and C.
When there is a connection between the 3 waves A,B and C, they become of the same length making it easier to spot. In this case, it forms a flat shape in the chart.
Also if there is a formation of a Zigzag shape, this means that wave B is shorter than that of A and C and this may cause an increase in the price of the asset.
Another pattern that can be noticed is a triangle pattern, it is shown when there is reduction in volume of the coin in the market. This pattern is usually difficult to spot.

What are your thoughts on this theory? Why?
From my understanding and research about this theory, I think it can be useful to many investors. Also I think it may be difficult for others too for example beginners who are still starting to learn from the crypto world. It needs very detailed understanding on the theory before you can be able to apply it in your analysis of cryptocurrencies. Some professionals too do struggle with this theory sometimes in their efforts to make analysis.
To be able to use this theory well, I think you should have a broad knowledge and understanding of it because I think it is very difficult to be applied. But reading and making more of research about it can help you to be able to apply it in trading.
Generally speaking, I think it is a difficult theory because, it can be difficult to spot the different type of waves in the chart. Some of the patterns are very precise and requires proper observation before making analysis and this may cause inaccurate analysis.
Also I recommend you use it together with other indicators just to be sure of your analysis before you make a decision. With that, you will have more advantage on making a really good technical analysis. But you can also decide to use it in combination with other analysis methods.

Choose a coinchart in which you were able to spot all impulse and correct waves and explain in detail what you see.
For the purpose of this demonstration, I chose to use BTC/USDT pair from the Binance chart.
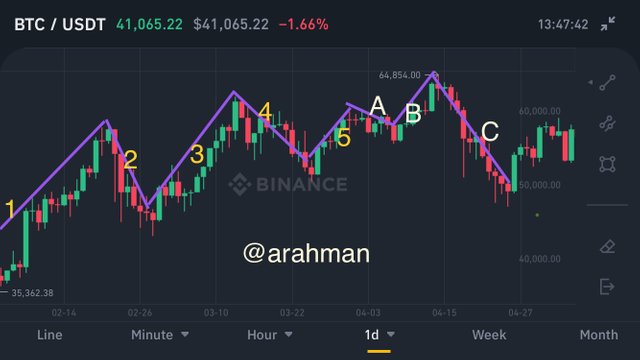
From the chart above, when the price of the asset was around $34,804 some investors decided to start a trade and due to the hard purchases of the asset, it caused a significant spike in the chart. That is to say, a bullish trend appeared. These created a suitable time for investors to enter the trade in the wave-1 of the chart.
After some time, it was then noticed that most of the investors decided to exit the trade due to the increase in the price of the asset and made profits.
Due to the hard sales of the asset, it caused a downward movement as it can be seen in the chart. Meaning there was some bearish period and it is shown in wave 2.
Then again, more investors realized the dip from wave-2 and took advantage to start an entry point and made more hard purchases
which was more than that in wave-1 causing a longer spike than wave-1 and this new spike is the wave-3. Due to this hard purchases by the more number of investors, it pushed the price of the asset much higher than before. In this case, investors who entered the trade would have made much more profits.
At this stage, most of the investors would see it very necessary to make an exit and accumulate their profits from the trade. With this, It would cause hard sales of the asset and consequently reducing drastically the price of the asset. This bearish trend is shown in wave-4 of the chart. After this bearish trend, another entry point will be created and investors will start trading again. After a while, they then exit the trade causing the 5th wave.
After all these 5 waves have passed, there comes the corrective wave. Wave A and C will move in an opposite direction of the original trend in order to correct the normal market trend.

Conclusion
I would say this Elliot wave theory cannot be used alone, but rather it should be used in combination with other indicators such as RSI so that you can make proper and detailed analysis of cryptocurrencies. With this, you will be able to make the right decision before you enter a trade.
I want to thank the professor @fendit for the well informed lecture. I have learned something new yet again and will continue to learn more.
Thank you for being part of my lecture and completing the task!
My comments:
Explanations were fine, I believe you could have ellaborated a bit more your answers.
When it comes to the chart, I'm not really convinced by it. Remember that wave 3 has to be the largest, and it seems as if wave 1 was larger than it.
Make sure you fully understand the lecture before submitting your work!
Overall score:
5/10
Thank you prof. I will put in maximum effort next time.