Crypto Academy Season 2 Week 4 Homework Post for @kouba01

Greetings to everyone, I am here once again to present my homework task which was given by professor @kouba01 in his recent lecture. The topic was Cryptocurrency Trading with RSI.
I will like to use this opportunity to thank him for the excellent lecture he gave, it has been really informative.
Question 1
What is the Relative Strength Index - RSI and How is it Calculated?
First of all, RSI simply stands for Relative Strength Index. It was developed by a one mechanical engineer name Welles Wilder about 43 years ago. Since it’s development, it has been widely used by many investors worldwide.
Due to the nature and how volatile the prices of cryptocurrencies are, traders have come to adopt some strategies in other to make more profits in their investment.
The RSI tool has come to prove a very useful tool in the trade of cryptocurrencies. This is because it helps traders to determine the appropriate time to buy or sell a crypto asset. With the help of this tool, an investor will be able to analyze and know when it is necessary to enter a trade or exit a trade. With this, investors are able to maximize their profits from their investment.
The RSI tool has a value ranging from 0-100 which is used to determine the increasing and decreasing strength of prices. When the value is 30 or below, it means that the crypto assets has been oversold and when it is between 70-100 it means the asset has been overbought.
What this tool actually does is that, it shows the trader the overbought and oversold period of a cryptocurrency.
How RSI is Calculated
The formula used in calculating RSI is show below:
RS is the ratio of P(positive closing price average) to N(negative closing price average)
So RS=P/N
Can we trust the RSI on cryptocurrency trading and why?
Even though the RSI is widely appreciated by many traders, it isn’t that perfect. With all the good importance it comes with it also may give you false signals sometimes.
This is why I recommend using the RSI tool in combination with other tools. This way, you will be sure if the signals you’re getting is correct or not. RSI is just an additional advantage which can improve your buying and selling of crypto assets.
Using the RSI tool with other tools can be very helpful.
How do you configure the RSI indicator on the chart and what does the length parameter mean? Why is it equal to 14 by default? Can we change it? (Screen capture required)
For the purpose of this demonstration I will be using the Trading View website.
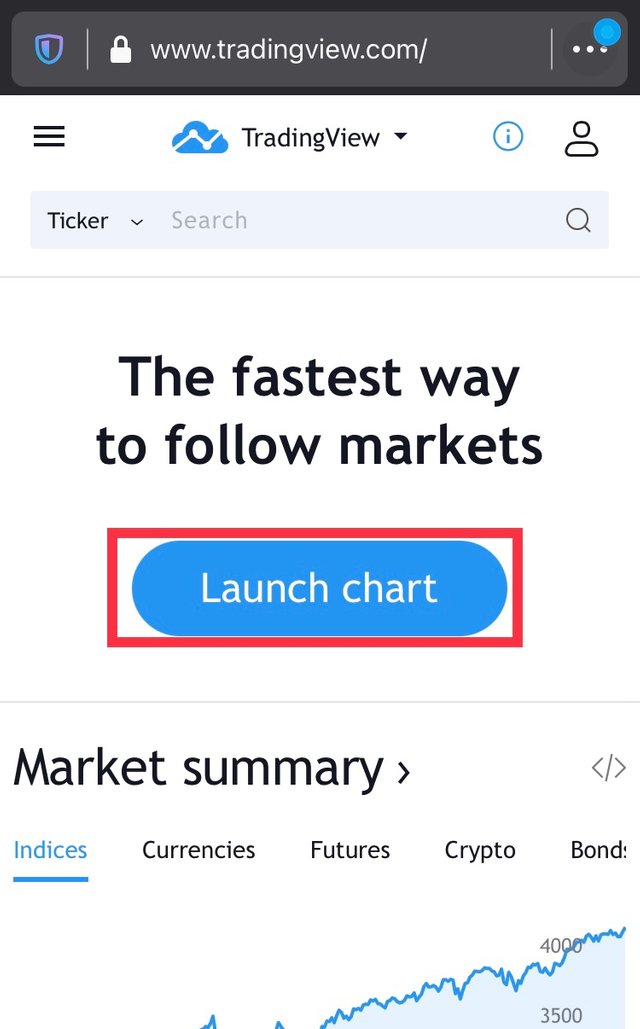
Open the website through this Link
After opening the website, click on “launch chart”
Click on “AAPL” to search and choose your desired crypto asset paring
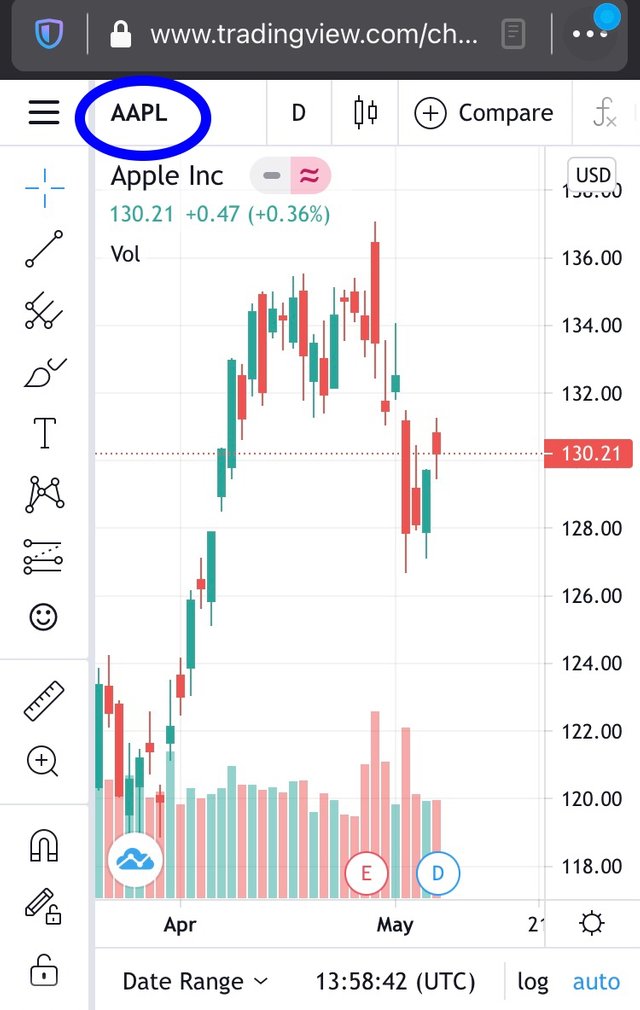
Search and choose your desired pair.
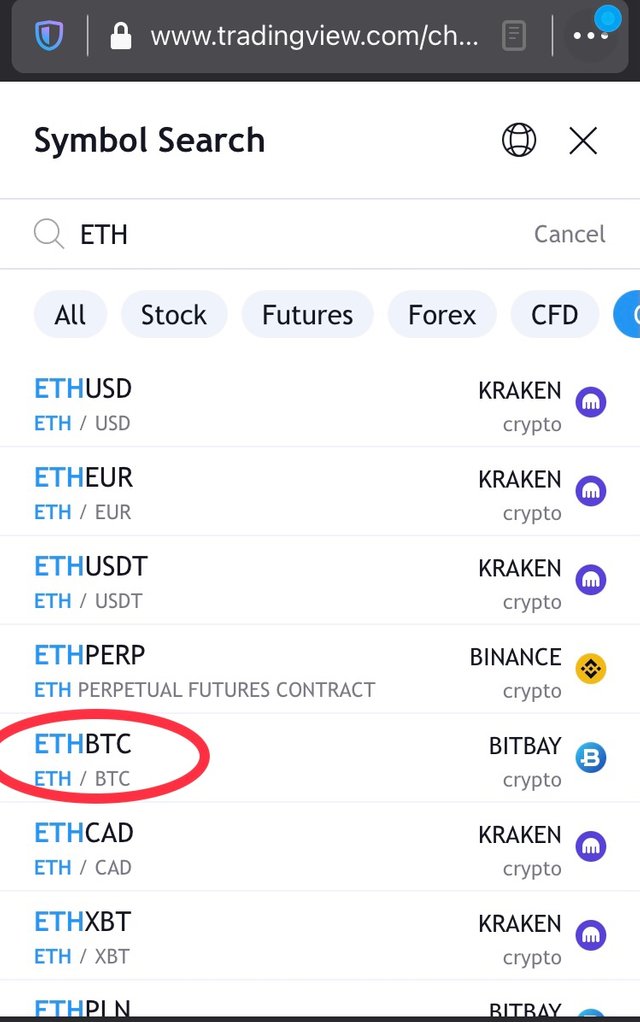
I will be using ETH/BTC pairingClick on “Fx indicators”
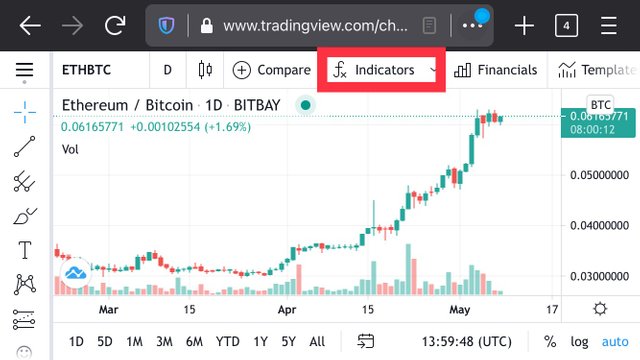
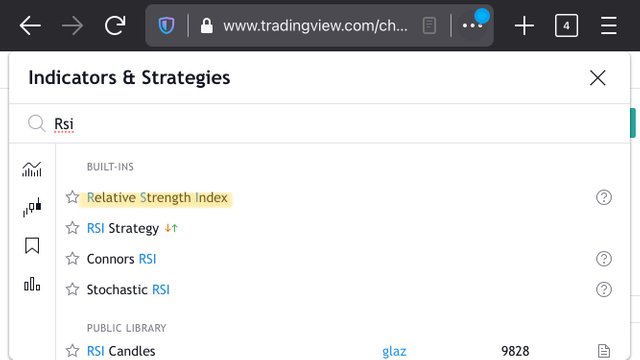
Type in the search box RSI and click on Relative Strength Index to display the indicator.
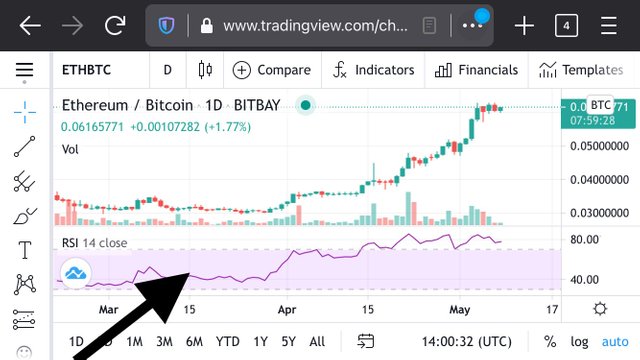
The arrow shows the displayed RSI indicator. Click on it to display settings.
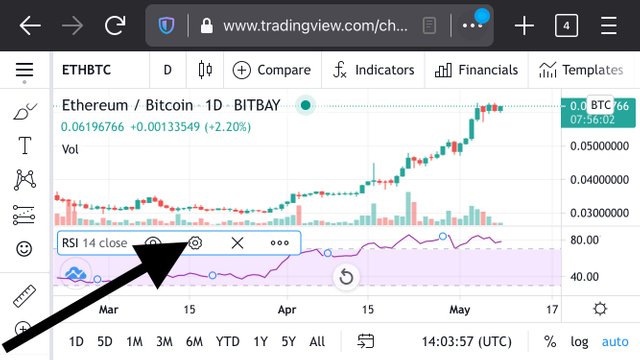
Click on settings (where the arrow is pointed at)
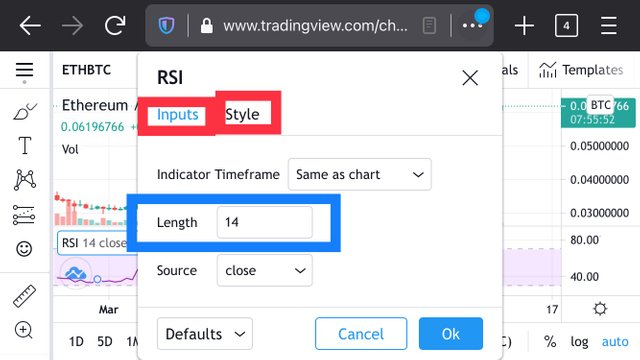
You can change the length at the input section and you can also change the color of the indicator at the style section. I decided to change my to 10. But by default it is set at a period of 14.
As you can see below I’ve made changes to the RSI tool. By changing the color of the upper and lower bands and also the RSI.
How do you interpret the overbought and oversold signals when trading cryptocurrencies? (Screen capture required)
I will be using the chart below to explain my answer.
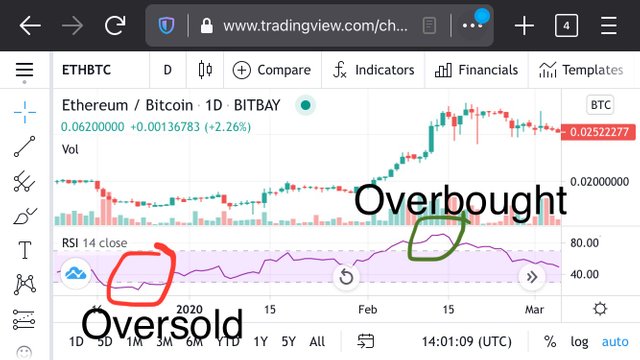
From my graph, I have shown the various signals by circling the overbought signal with green and the oversold signal with red.
When there is a high demand than the supply of a cryptocurrency asset in the crypto market, it increases the market price of that asset. As a result the RSI indicator level will then go between the 70 and 100 value. This is when you can see the overbought signal.
Also when there is higher supply of the crypto assets than the demand, it leads to an increase in market value of the assets. As a result, the RSI value will fall between 0-30 indicating oversold of the asset.
How do we filter RSI signals to distinguish and recognize true signals from false signals. (Screen capture required)
In some cases, there are deviations caused when false signals are mixed up with correct signals. You can get false signals in the following ways; Bullish divergence and Bearish divergence.
I will try to explain the two below.
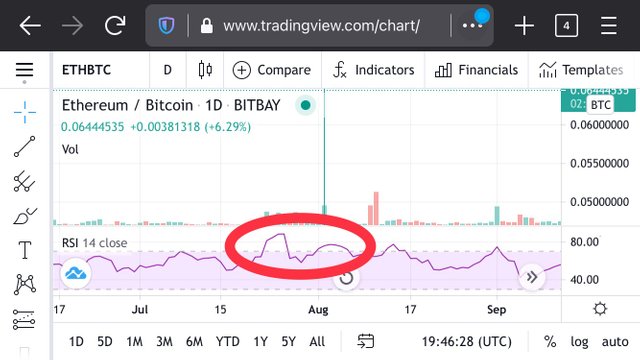
Bearish divergence
The RSI indicator shows a lower signal which is a false signal when the price of the crypto asset falls beyond the limit. This usually occurs when there is an overbought of the asset.
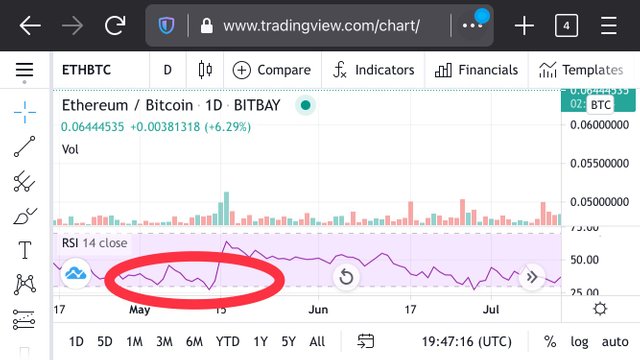
Bullish Divergence
This occurs when RSI indicator shows a signal that is greater than the real signal of the price fall of an asset. This situation is likely to occur when there is an oversold of an asset. The deviation can be correct when there is smooth movement in the price of the asset.
Review the chart of any pair (eg TRX / USD) and present the various signals from the RSI. (Screen capture required)
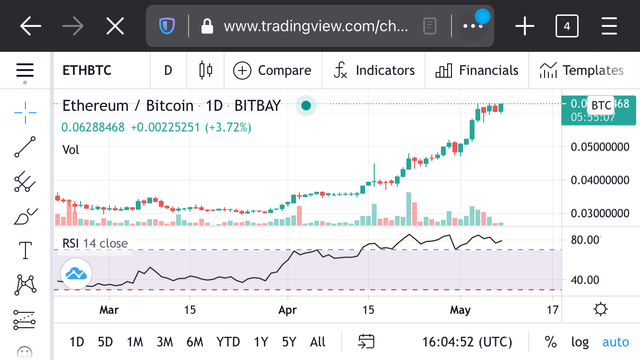
For this demonstration I have chosen the pair ETH/BTC.
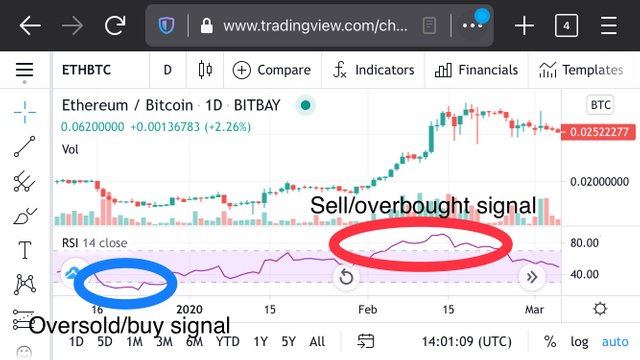
As shown in the chart above, you can notice that the RSI value of the asset fell below 30 and as a result created an oversold signal. This means that it was the right time to make a purchase of the asset since the price would have fallen too.
Also, in the chart you can see that at some time, the RSI value was above 70 and therefore created an overbought signal. At this moment it was a good time to sell your asset if you were holding any. Profits would have been made since the price of the asset would have increased.
Basically the overbought and oversold signals helps you to determine when to enter a trade and when to exit the trade.
Conclusion
Generally, I think the RSI can be of good use if you’re using it with other signal indicators. It can help you maximize your profits with the help of careful analysis.
Lastly I want to thank the professor, @kouba01 for the lecture he delivered. I happy to have learned something new again this week and wish to learn more. Thank you for reading.
Hello @arahman,
Thank you for participating in the 4th Week Crypto Course in its second season and for your efforts to complete the suggested tasks, you deserve a 5/10 rating, according to the following scale:
My review :
An average content. The question of signal filtering still lacks more depth in several points and for the last question, you had to analyze more price change by explaining the semantics of the added signals.
Thanks again for your effort, and we look forward to reading your next work.
Sincerely,@kouba01
Thank you prof. I’ll put in maximum effort in the next lecture.